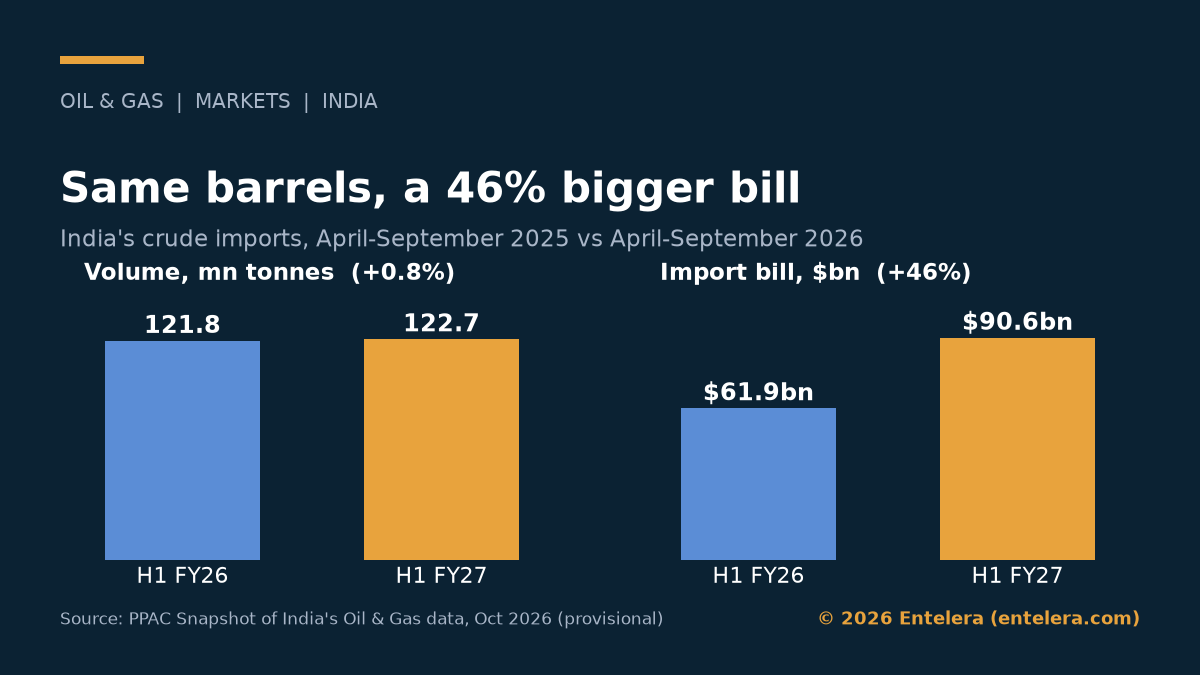
India paid $90.6bn for imported crude oil in April-September 2026, the first half (H1) of the 2026-27 financial year (FY27). That is 46% more than the $61.9bn it paid a year earlier. Yet volumes barely moved. For India, the crude import bill rose almost entirely on price, according to the Petroleum Planning and Analysis Cell (PPAC), the oil ministry’s data arm.
This analysis splits the rise into price and volume. Then it follows the money through the rupee, the trade deficit and the public finances. It also looks at where the barrels came from and what the next few months may bring. Note that all PPAC figures for FY27 are provisional.
The crude import bill India paid in H1 FY27
PPAC’s October 2026 snapshot, released late on 16 October, gives the core numbers:
- Import bill: $90.6bn, against $61.9bn in April-September 2025 (up 46.3%)
- Volume: 122.7mn tonnes, against 121.8mn tonnes (up 0.8%)
- In rupees: INR8.53tn ($90.6bn)
- September alone: $15.4bn, against $10.5bn a year earlier
- Share of last year’s bill: 72% of the $125.8bn paid in the whole of FY26
In barrels, 122.7mn tonnes is about 899mn barrels, using PPAC’s own factor of 7.33 barrels a tonne. Spread over 183 days, that is about 4.9 mmbbl/d of imported crude. So India bought only about 6.6mn more barrels than a year earlier, or an extra 0.04 mmbbl/d.
Price vs volume behind the crude import bill in India
Dividing the bill by the barrels gives an average cost of about $100.7/bbl in H1 FY27. A year earlier, the same sum gives about $69.3/bbl. In other words, the crude import bill for India rose because each barrel cost about 45% more, while the number of barrels rose by less than 1%. Rounded, that is about $101/bbl against $69/bbl.
Splitting the $28.7bn increase makes the point plainly:
- Higher price: about $28.0bn, or 98% of the rise
- Extra volume: about $0.5bn
- Both together: about $0.2bn, for the extra barrels bought at the higher price
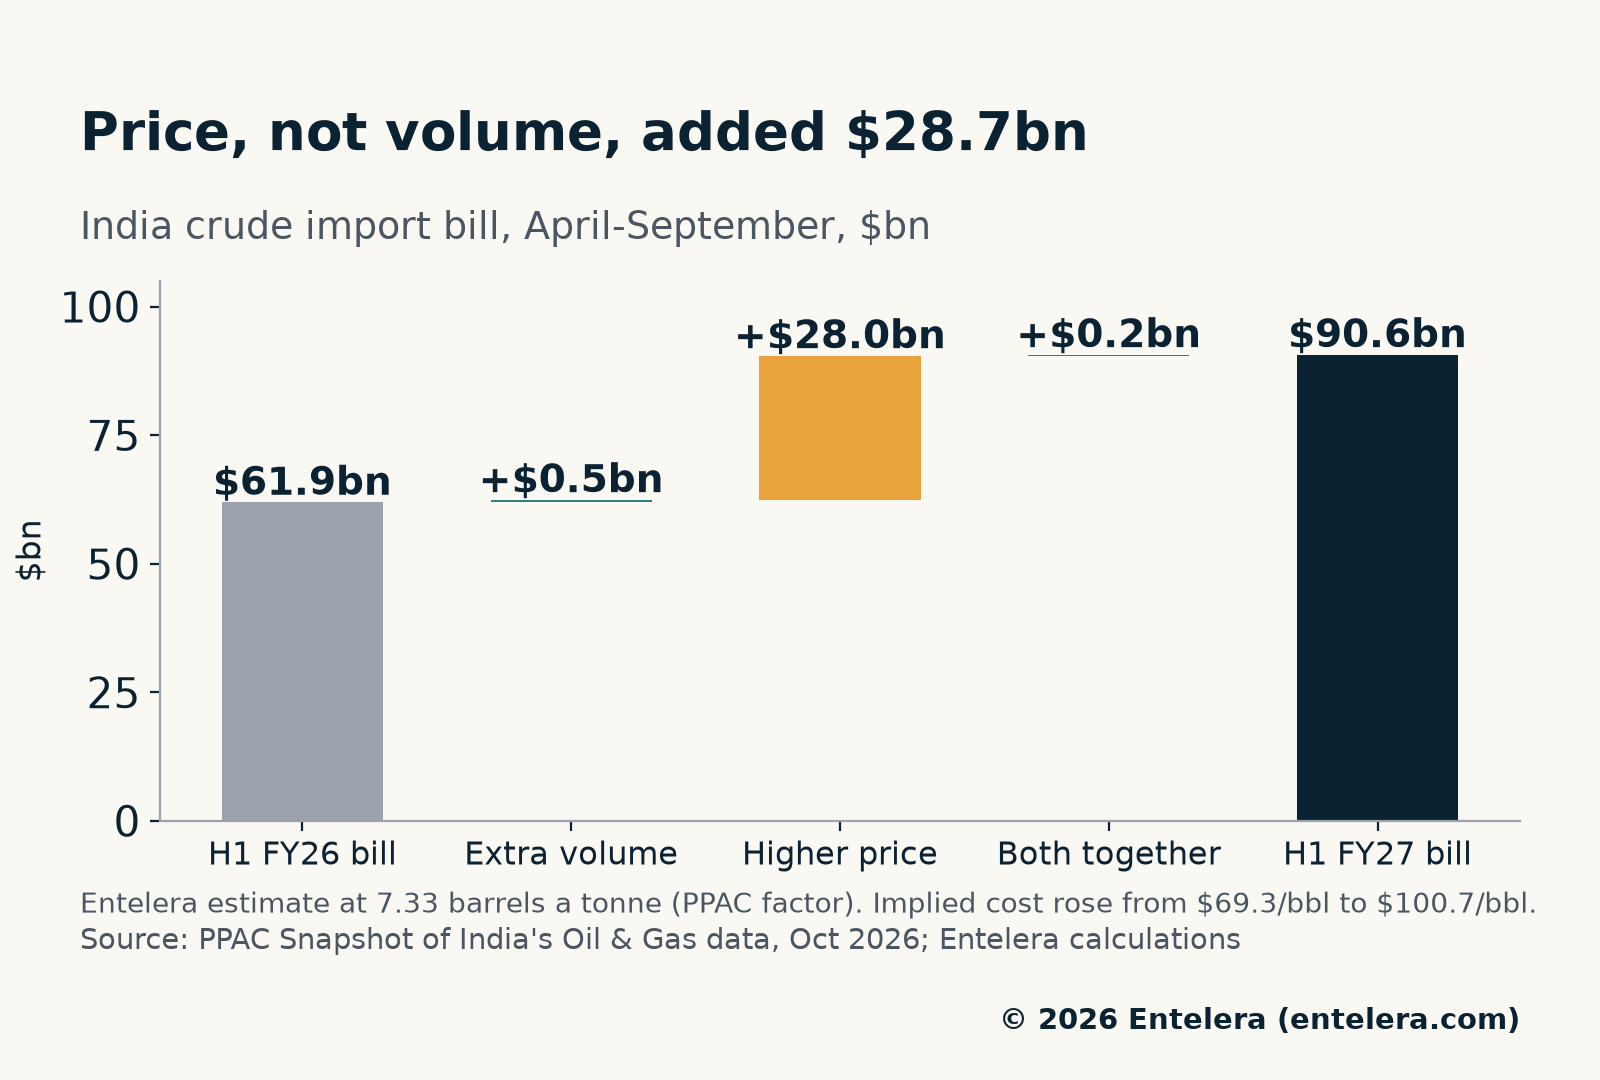
These per-barrel figures are Entelera estimates, not PPAC data. The bill includes freight and insurance, and crude grades differ in density. So a single tonne-to-barrel factor is only an approximation. Even so, the direction is clear: almost all of the extra cost came from price.
Two quarters, two price shocks
The half-year hides a sharp swing. According to the Financial Express, citing PPAC, the crude bill reached $49.8bn in April-June, up 61% on the year, for 59.8mn tonnes. That implies about $114/bbl, as the West Asia conflict and disruption in the Strait of Hormuz pushed prices up. Our Strait of Hormuz analysis covers those flows.
Then the pressure eased. On the same basis, July-September cost about $40.8bn for roughly 62.9mn tonnes, or about $88/bbl. However, September turned higher again. The Indian basket, PPAC’s average price of the crude grades India buys, rose to $116.09/bbl from $90.19 in August and $69.61 a year earlier. Meanwhile, Brent averaged $116.77/bbl.
Why the crude import bill in India lags oil prices
Import bills and spot prices do not move in step. In September, a bill of $15.4bn for 21.7mn tonnes implies about $96.8/bbl, nearly $20 below the basket. In August, Hindustan Times reported a bill of $11.7bn for 19.0mn tonnes, or about $84/bbl against a basket of $90.19.
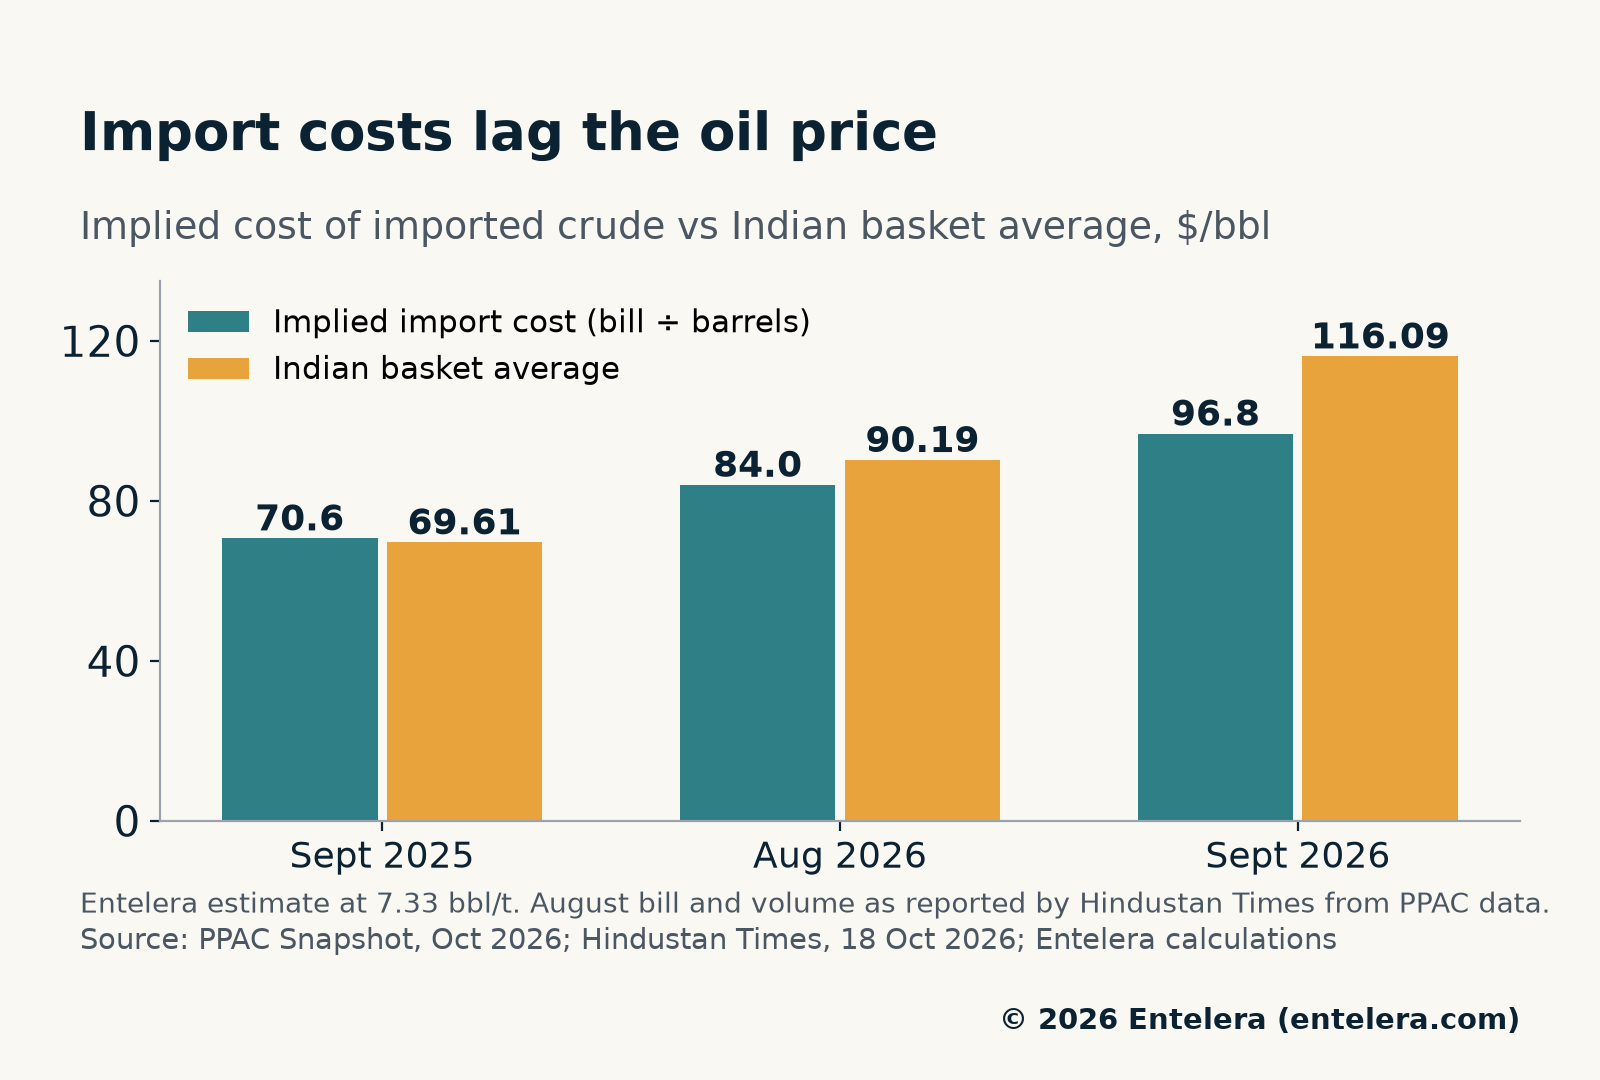
One likely reason is timing. Sellers often price cargoes around loading, and the oil then arrives weeks later. As a result, the bill tends to reflect earlier prices. If that pattern holds, September’s $116 basket has not yet fully reached the crude import bill for India. October’s data, due in November, will show how much.
The rupee adds a second layer
Indian refiners pay for crude in dollars but earn in rupees. PPAC’s rupee and dollar values imply an average rate of about INR94.2 per dollar in H1 FY27. For FY26 as a whole, the same tables imply about INR88.6.
As a result, the crude import bill for India has grown faster in rupees than in dollars. The H1 rupee bill of INR8.53tn is already 77% of the FY26 total of INR11.15tn ($125.8bn), against 72% in dollar terms. At last year’s average rate, the same dollar bill would have cost about INR8.02tn. So the weaker currency added roughly INR0.51tn ($5.4bn) in rupee terms.
The currency remains under strain. The rupee hit a record low of 96.96 per dollar in May, Reuters reported. From 12 October, the Reserve Bank of India (RBI) let Indian Oil, Hindustan Petroleum and Bharat Petroleum buy dollars through a special window, away from the spot market. By 19 October, the rupee had recovered to about 94.8 per dollar. Unless stated otherwise, this article converts rupee amounts at INR94.9 per dollar.
Oil explains most of the wider trade deficit
India’s merchandise trade deficit reached $177.6bn in April-September, up $20.8bn on a year earlier, commerce ministry data show. Over the same period, PPAC puts the net oil and gas import bill at $81.1bn, up $20.9bn. In other words, the rise in the net energy bill roughly matched the whole increase in the goods trade gap. The two datasets differ in coverage, though, so the match is only approximate.
Petroleum now makes up 22.7% of India’s gross imports by value, up from 19.5%. The crude import bill alone is about 21% of the $437.5bn of goods that India imported. By contrast, fuel exports offered some relief. Product export earnings rose to $26.6bn from $19.9bn, even as export volumes fell to 26.2mn tonnes from 31.9mn tonnes.
The current account shows the same strain. RBI data put the current account deficit at $4.2bn, or 0.5% of GDP, in April-June, up from $3.4bn a year earlier. The net import bill for petroleum, oil and lubricants widened to $37.6bn from $32.2bn. However, remittances of $42.9bn, up from $33.2bn, helped to keep the deficit small.
Fiscal cost of the crude import bill in India
The government has chosen to absorb part of the shock rather than pass it on at the pump. On 27 March, it cut excise duty on petrol and diesel by INR10 ($0.11) a litre and left pump prices unchanged. Instead, the Press Information Bureau said, the cut would reduce the losses of state-run fuel retailers.
That relief has a price. The Central Board of Indirect Taxes and Customs put the revenue loss at INR70bn ($738mn) a fortnight. New export duties on diesel and jet fuel claw back about INR15bn ($158mn). So the net loss is about INR55bn ($580mn) every two weeks. Moneycontrol estimated the annual cost at about INR1.43tn ($15.1bn) if the changes stay in place.
Even so, the oil companies still carry much of the burden. PPAC data show that state-run downstream companies made a combined net loss of INR181.5bn ($1.9bn) in April-June. Also, Indian Oil’s borrowings rose to INR1.41tn ($14.9bn) at the end of June from INR1.11tn ($11.7bn) in March. Meanwhile, the budget targets a fiscal deficit of 4.3% of GDP for FY27. A lasting price shock leaves less room to meet that goal.
Import dependence stays near 88%
India met 88.1% of its crude needs from imports in H1, on PPAC’s consumption basis, against 88.3% a year earlier. At the same time, domestic crude and condensate output fell 3.5% to 13.7mn tonnes, or about 0.55 mmbbl/d. In contrast, Indian refineries processed about 5.45 mmbbl/d.
Demand did not drive the crude import bill in India. Total fuel consumption fell 3.3% to 114.8mn tonnes, led by a 15.5% drop in LPG and an 18% drop in naphtha. However, transport fuels kept growing: diesel rose 4.9% and petrol 7.1%. So the fuels that keep cars and lorries moving still need more crude each year.
Russia vs West Asia: a costlier mix
Where the barrels come from also matters. Ship-tracking firm Kpler, quoted by the Financial Express, put Russian crude imports at 1.88 mmbbl/d in September, down from a July peak of 2.83 mmbbl/d. Russia’s share of India’s imports fell to 35.3% from 55.9%. By contrast, West Asian suppliers rose to 2.10 mmbbl/d, or 39.5% of imports, led by Iraq, Saudi Arabia, the UAE and Kuwait.
The shift adds to the crude import bill for India. Refiners have replaced discounted Russian oil with crude from the US, West Africa, South America and West Asia, Hindustan Times reported, citing industry executives. That oil costs more, partly because of higher freight and insurance. Refiners began to cut Russian purchases before the US Sanctioning Russia and Iran Act became law on 18 September. Since then, Washington has held off the tariffs of up to 100% that the act could trigger.
Trackers differ on the detail, though. The Global Trade Research Initiative put Russia’s share at 51% in July and 44% in August, below Kpler’s figures. Our Russian crude fuel exports analysis covers the European side of this trade.
Outlook for the crude import bill in India
The second half starts from a high base. Brent touched $110 a barrel on 16 October for the first time since May, and traded near $108 on 19 October. Our Brent at $110 analysis sets out the drivers. If the lag between prices and import costs holds, the October bill could rise further even at steady volumes.
A simple rule of thumb shows the exposure. At about 4.9 mmbbl/d, every $10/bbl rise adds roughly $1.5bn a month, or about $18bn a year, to the crude import bill for India. This Entelera estimate holds volumes and the rupee steady.
In our view, India cannot set the oil price. However, it can cut its exposure over time through higher domestic output, faster electrification of transport and deeper strategic storage. None of these will change the FY27 bill. Instead, they decide how hard the next shock hits.
What to watch next
- PPAC’s November snapshot, with October data, for the first full sign of September’s $116 basket in the bill.
- RBI’s July-September balance of payments, for the size of the oil hit on the current account.
- The fortnightly review of export duties on diesel and jet fuel, and any change to excise duty.
- Second-quarter results from Indian Oil, BPCL and HPCL, for the scale of fuel retail losses.
- US enforcement of the Sanctioning Russia and Iran Act, which could reshape Russian supply to India.
In short, India paid a 46% higher crude import bill for almost the same oil. That makes oil a macro story for India, not just an energy story. Our news report on the PPAC data has the key numbers at a glance.
Sources
- PPAC, “Snapshot of India’s Oil & Gas data”, October 2026 (data to September 2026, provisional): ppac.gov.in (PDF)
- ThePrint, “India’s crude import bill jumps 46% to $90.6 billion in April-September as oil prices surge”, 17 October 2026: theprint.in
- Financial Express, “India pays nearly $29 billion more for almost same crude volumes in H1”, 19 October 2026: financialexpress.com
- Hindustan Times, “Deferred 100% US tariffs offer only temporary relief to India as Russian oil imports fall”, 18 October 2026: hindustantimes.com
- Financial Express, “West Asia crude regains ground in India’s basket” (Kpler data), 1 October 2026: financialexpress.com
- Ministry of Commerce and Industry, India’s foreign trade, September 2026, 15 October 2026: commerce.gov.in (PDF)
- Reserve Bank of India, “Developments in India’s Balance of Payments during the First Quarter (April-June) of 2026-27”: rbi.org.in
- Press Information Bureau, excise duty reduction on petrol and diesel, 27 March 2026: pib.gov.in
- Moneycontrol, report on the Centre’s net revenue loss each fortnight from the fuel duty changes, March 2026: moneycontrol.com
- The Economic Times (Reuters), “Explained: How RBI is trying to arrest the rupee’s slide”, 12 October 2026: economictimes.indiatimes.com
- The Times of India, “Rupee rises to 94.80 against US dollar, but crude oil threatens recovery”, 19 October 2026: timesofindia.indiatimes.com
- Moneycontrol (Reuters), “Oil, foreign flows in focus for rupee; bond traders eye rate-hike bets”, 19 October 2026: moneycontrol.com