Equinor Q3 results showed adjusted operating income of $12.35bn for the third quarter of 2026. The Norwegian company also raised its 2026 oil and gas production growth guidance to about 4%, from 3%. However, adjusted earnings per share of $1.20 fell short of the $1.36 analysts expected, according to Investing.com.
Reported net operating income more than doubled to $11.95bn, from $5.27bn a year earlier. In contrast, net income came in at $2.54bn and adjusted net income at $2.86bn. Revenue reached $33.19bn, slightly below the $33.60bn forecast. Chief financial officer Torgrim Reitan said foreign exchange movements in net financial items weighed on earnings.
Higher output and prices drive Equinor Q3 2026 results
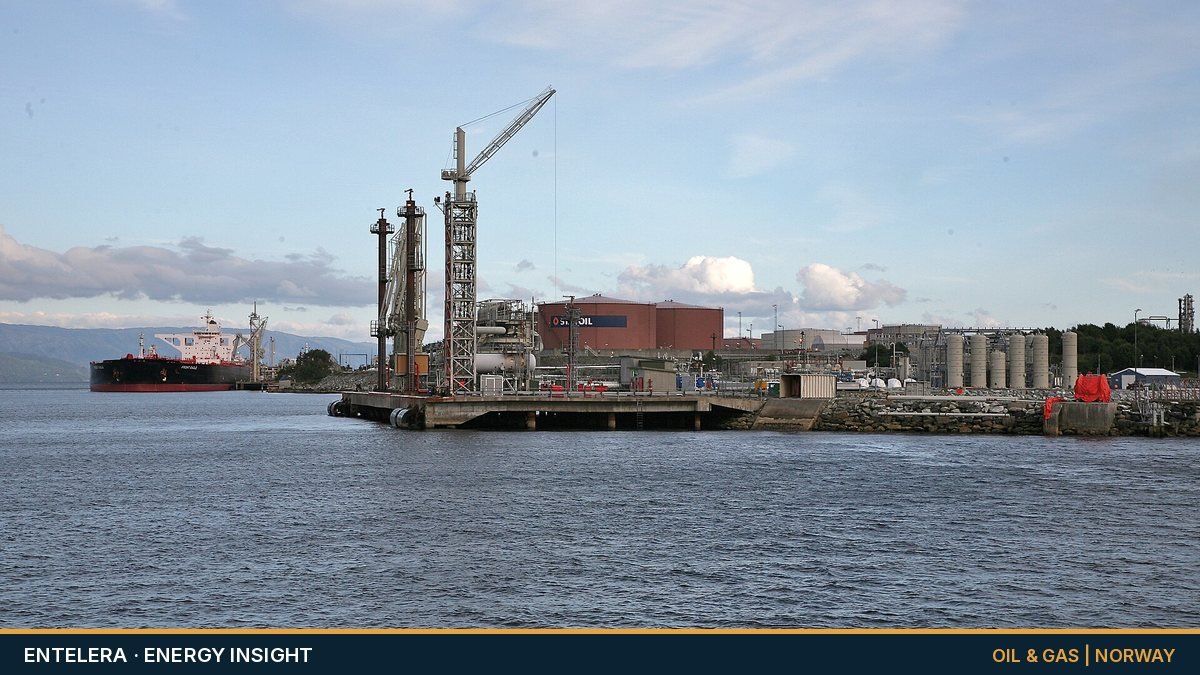
Equity production rose 2% from a year earlier to 2.17 mmboe/d. On the Norwegian Continental Shelf, output held steady as new fields such as Halten East and Verdande offset natural decline. Meanwhile, international production rose 21%, helped by Adura in the UK and Bacalhau in Brazil. Year to date, production growth stands at almost 5%.
“High production in the third quarter enabled us to capture additional value from higher prices,” said chief executive Anders Opedal. Equinor realised a European gas price of $20.0/MMBtu and a liquids price of $92.3/bbl. In addition, renewable power generation rose 26%, mainly thanks to Dogger Bank.
Record quarter at Mongstad
Refining was the standout. Equinor’s Mongstad refinery near Bergen posted a record result of $893mn, according to the earnings call. That is more than double the $400mn quarterly guidance. Strong refining margins and steady operations drove the result, while LNG trading also helped.
Cash flow, dividend and buybacks
Cash flow from operations after tax reached $8.1bn, after Equinor paid $6.2bn in Norwegian tax instalments. As a result, the year-to-date total is $21.8bn. Organic capital spending was $3.3bn in the quarter. Moreover, the net debt ratio fell to 3.8%, from 10.4% at the end of the second quarter of 2026.
The board kept the quarterly dividend at $0.39 per share. It also launched a fourth and final 2026 buyback tranche of up to $1.125bn, which runs from 29 October 2026 to 1 February 2027. That brings total 2026 buybacks to $3bn.
At current forward prices, Equinor now expects full-year cash flow from operations of about $29bn. By comparison, it guided $25bn at its June 2026 Capital Markets Day, which assumed $80 Brent and $15 gas.
What Equinor Q3 2026 results say about Europe’s gas market
Equinor sells most of its Norwegian gas into Europe, so its view of winter matters. Reitan said European gas storage stands at 73%, the lowest since 2011, while prices are above $30/MMBtu. He added that very few LNG cargoes are passing the Strait of Hormuz. A cold spell “will drive possibly significant volatility”, he said, though he expects Europe to manage. For context, QatarEnergy has just extended its LNG force majeure to end-2026.
What comes next
Several projects shape 2027. First, Shell bought 30% of the Bay du Nord project in Canada in October 2026, and Equinor targets an investment decision early next year. Second, Empire Wind in the US is about 80% complete, with first power now due in the first half of 2027. Finally, Rosebank in the UK should start production in the first half of 2027. Still, Reitan warned that Johan Sverdrup will decline faster next year than in 2026.