Reports Oil & Gas

Report · Oil & Gas

BP Q3 2026 results: financial summary

BP made $8.46bn of underlying replacement cost profit in Q3 2026 and cut net debt by $8.4bn, but paid no buyback. Profit, cash, debt and segments, from the company’s own results.

By Entelera Research

Summary

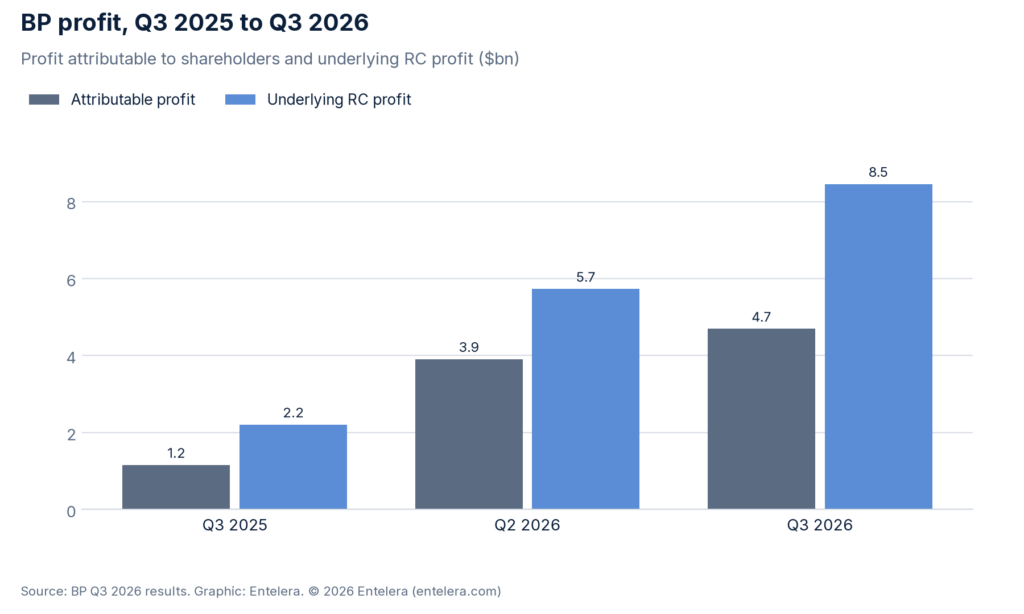
BP reported underlying replacement cost (RC) profit of $8.46bn for the third quarter of 2026 on 30 October 2026, up 48% on Q2 2026’s $5.73bn and almost four times the $2.21bn of Q3 2025. Profit attributable to shareholders was $4.70bn, after $4.0bn of post-tax impairments.

Key numberQ3 2026Change
Underlying RC profit$8.46bn+48% vs Q2 2026; +283% vs Q3 2025
Profit attributable to shareholders$4.70bn+20% vs Q2 2026; +304% vs Q3 2025
Operating cash flow$14.8bn+37% vs Q2 2026; +90% vs Q3 2025
Net debt, 30 September 2026$13.9bn-$8.4bn in the quarter; gearing 14.8%
Source: BP Q3 2026 results.

The free summary and the full 6-page report ($9.99) are on the report page: use “Buy full report” above.
Key findings

  • Underlying RC profit of $8.46bn in Q3 2026, up 48% on Q2 2026 and almost four times Q3 2025.
  • Profit attributable to shareholders of $4.70bn after $4.0bn of post-tax impairments.
  • Operating cash flow of $14.8bn; net debt cut by $8.4bn to $13.9bn; gearing 14.8%.
  • No share buyback in the quarter; excess cash to go to Deepwater Horizon liabilities first.
  • Customers & products made $6.95bn of underlying profit before interest and tax.
  • Strategy and outlook update on 15 December 2026.

Sample chart

Bar chart of BP profit: attributable profit $1.2bn in Q3 2025, $3.9bn in Q2 2026 and $4.7bn in Q3 2026; underlying RC profit $2.2bn, $5.7bn and $8.5bn
BP’s underlying RC profit reached $8.46bn in Q3 2026; impairments held reported profit to $4.70bn. Source: BP Q3 2026 results.

Table of contents

  1. Headline numbers vs the prior quarter and the prior year
  2. Profit: reported and adjusted
  3. Revenue and operating cash flow
  4. Capex, net debt and gearing
  5. Buybacks and dividends
  6. Segment results
  7. Production and throughput
  8. Guidance and outlook
  9. What it means
  10. Notes on the numbers and sources

Methodology

Built only from BP’s own published results documents for the period (results release, financial statements or stock-exchange filing) listed in the Sources section. No broker, consensus or paywalled data. Changes are Entelera calculations from the published figures. Non-US-dollar amounts are converted at the rate stated in the notes.