Reports Oil & Gas

Report · Oil & Gas

Equinor Q3 2026 results: financial summary

Equinor made $12.35bn of adjusted operating income in Q3 2026, almost double a year earlier, and cut its net debt ratio to 3.8%. Profit, cash, returns and segments, from the company’s own results.

By Entelera Research

Summary

Equinor reported adjusted operating income of $12.35bn for the third quarter of 2026, up 8% on Q2 2026 and 99% on the $6.22bn of Q3 2025. After Norway’s high petroleum taxes, adjusted net income was $2.86bn, or $1.20 a share, and net income was $2.55bn, against a small loss a year earlier.

Key numberQ3 2026Change
Adjusted operating income$12.35bn+8% vs Q2 2026; +99% vs Q3 2025
Adjusted net income$2.86bn-11% vs Q2 2026; +207% vs Q3 2025
Cash flow from operations after taxes paid$8.14bn+6% vs Q2 2026; +53% vs Q3 2025
Net debt to capital employed (adjusted)3.8%10.4% at 30 June 2026
Source: Equinor Q3 2026 financial statements and review.

The free summary and the full 6-page report ($9.99) are on the report page: use “Buy full report” above.
Key findings

  • Adjusted operating income of $12.35bn in Q3 2026, up 99% on Q3 2025.
  • Adjusted net income of $2.86bn ($1.20 a share) after Norwegian petroleum tax.
  • Cash flow from operations after taxes paid of $8.14bn, after $6.2bn of tax instalments.
  • Net debt to capital employed adjusted down to 3.8% from 10.4%.
  • Dividend of $0.39 a share; fourth buyback tranche of up to $1.13bn; 2026 buyback up to $3bn.
  • 2026 production growth guided at ~4%; organic capex ~$13bn.

Sample chart

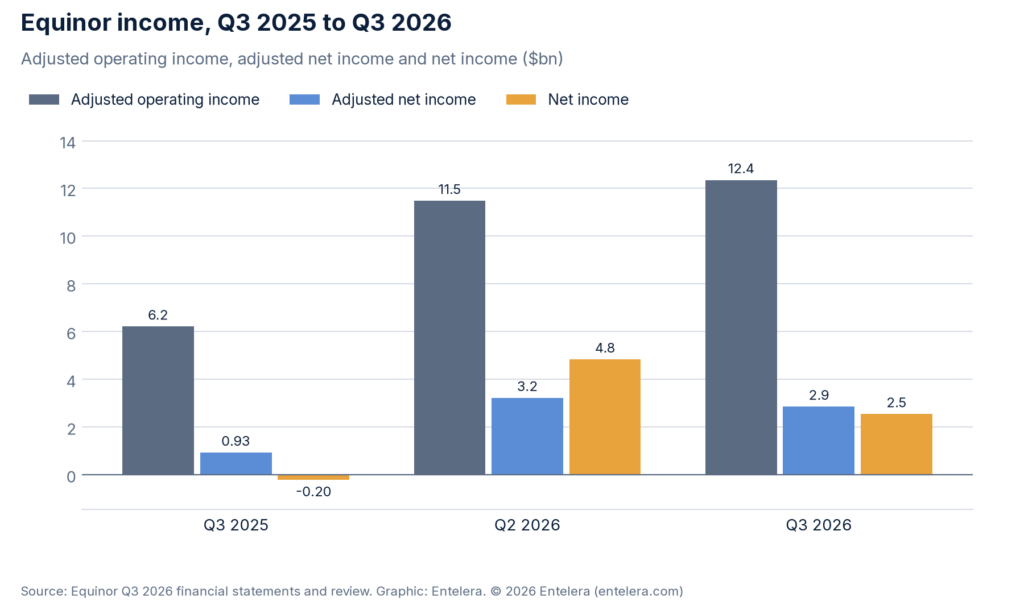
Bar chart of Equinor income: adjusted operating income $6.2bn in Q3 2025, $11.5bn in Q2 2026 and $12.4bn in Q3 2026; adjusted net income $0.9bn, $3.2bn and $2.9bn; net income -$0.2bn, $4.8bn and $2.5bn
Equinor’s adjusted operating income almost doubled on the year; Norwegian tax takes most of it before net income. Source: Equinor Q3 2026 financial statements and review.

Table of contents

  1. Headline numbers vs the prior quarter and the prior year
  2. Profit: reported and adjusted
  3. Revenue and operating cash flow
  4. Capex, net debt and gearing
  5. Buybacks and dividends
  6. Segment results
  7. Production and throughput
  8. Guidance and outlook
  9. What it means
  10. Notes on the numbers and sources

Methodology

Built only from Equinor’s own published results documents for the period (results release, financial statements or stock-exchange filing) listed in the Sources section. No broker, consensus or paywalled data. Changes are Entelera calculations from the published figures. Non-US-dollar amounts are converted at the rate stated in the notes.