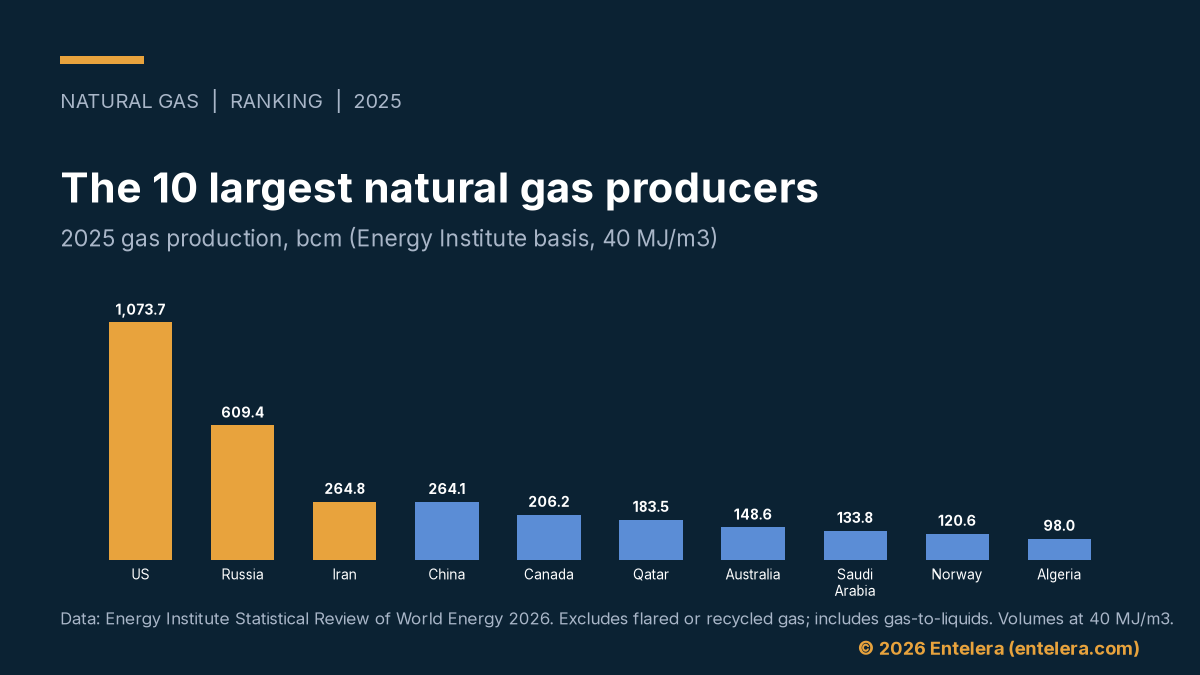
The United States led the largest natural gas producers in 2025, at 1,073.7 bcm. Russia followed at 609.4 bcm, and Iran at 264.8 bcm. Overall, the top 10 produced 3,102.7 bcm, or 73.9% of world output.
To begin with, we ranked countries by calendar-year gas production. The source is the Energy Institute Statistical Review of World Energy 2026, released on 30 June 2026. Specifically, the measure includes gas produced for gas-to-liquids. By contrast, it excludes flared or recycled gas. Volumes follow the Energy Institute’s 40 MJ/m3 standard, so they may differ from national figures. World output was 4,196.5 bcm, up 1.6% on 2024.
The ranked table of the largest natural gas producers
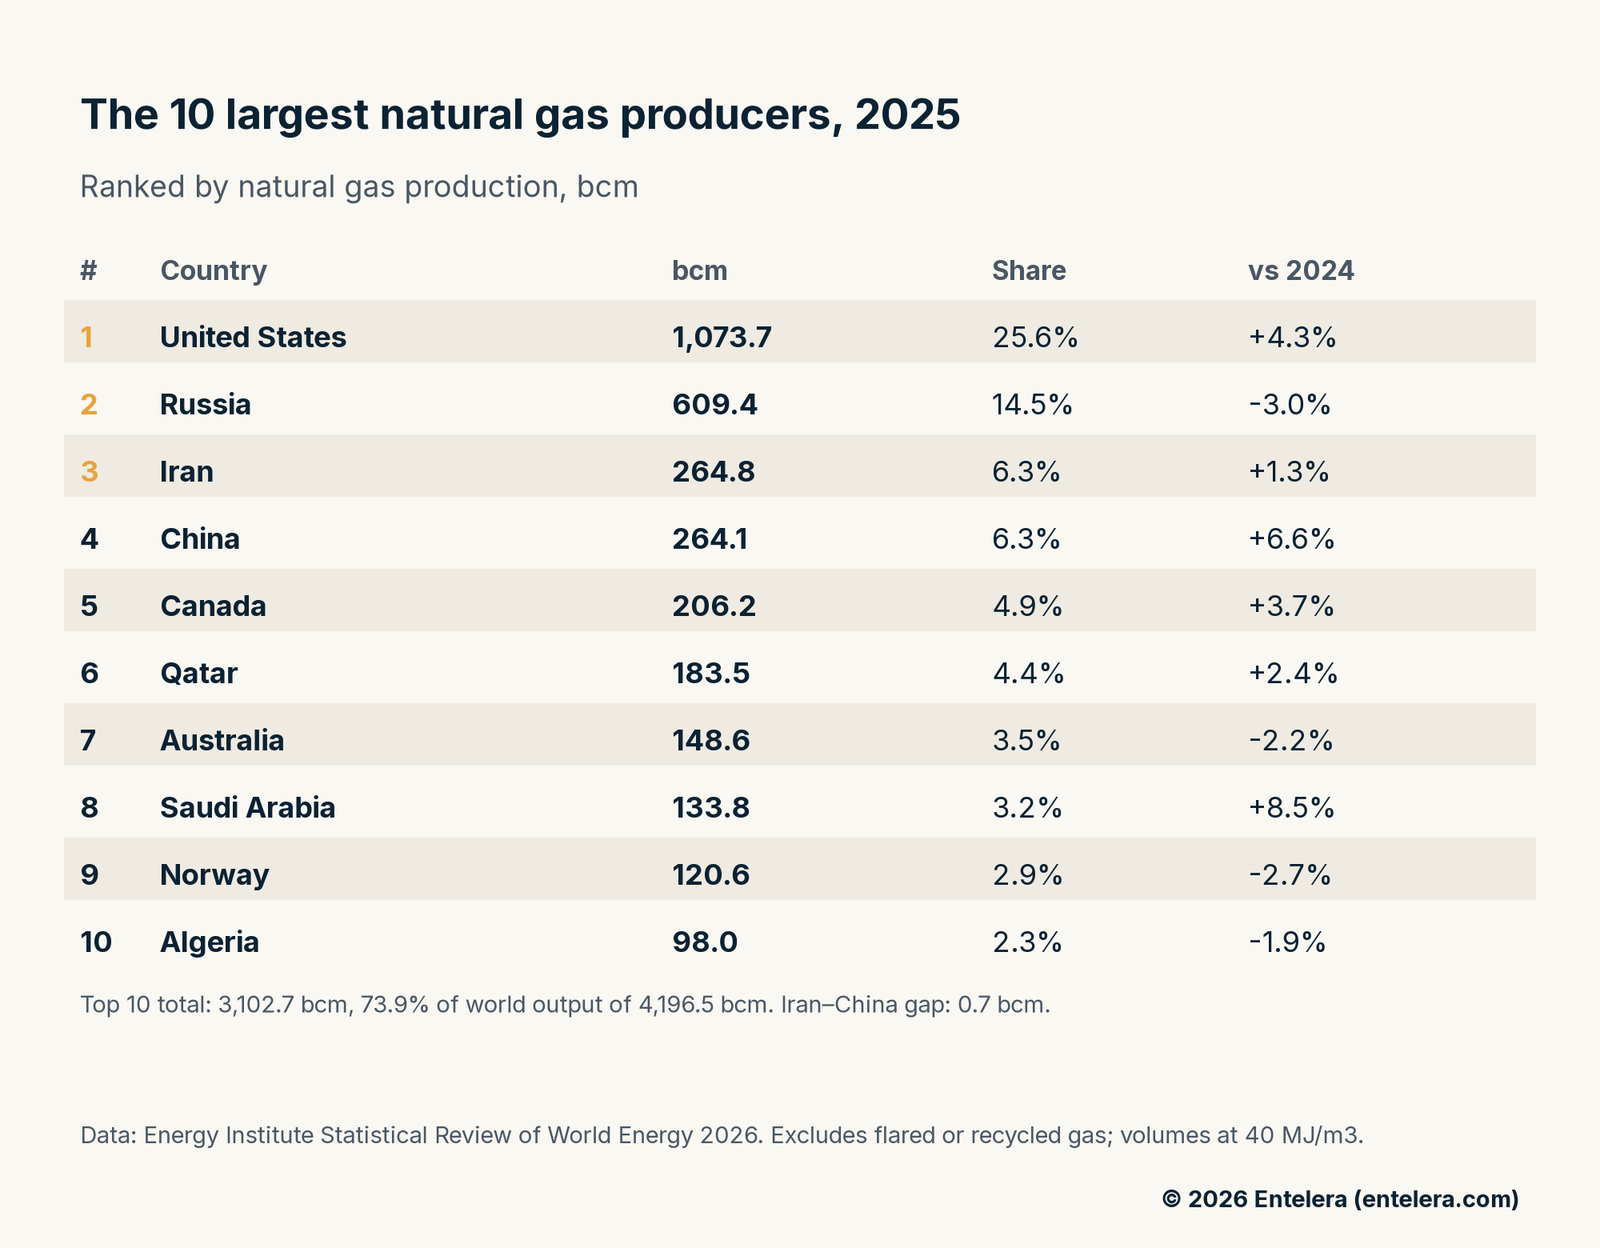
- 1) United States: 1,073.7 bcm, 25.6% of world output, up 4.3%.
- 2) Russia: 609.4 bcm, 14.5%, down 3.0%.
- 3) Iran: 264.8 bcm, 6.3%, up 1.3%.
- 4) China: 264.1 bcm, 6.3%, up 6.6%.
- 5) Canada: 206.2 bcm, 4.9%, up 3.7%.
- 6) Qatar: 183.5 bcm, 4.4%, up 2.4%.
- 7) Australia: 148.6 bcm, 3.5%, down 2.2%.
- 8) Saudi Arabia: 133.8 bcm, 3.2%, up 8.5%.
- 9) Norway: 120.6 bcm, 2.9%, down 2.7%.
- 10) Algeria: 98.0 bcm, 2.3%, down 1.9%.
In fact, Russia and Iran together produced 874.2 bcm, still less than the United States. The Energy Institute describes US output as on par with Russia, Iran and China combined. Those three produced 1,138.3 bcm, so the US figure is 94% of that total. Further, the same ranking is in the Entelera LinkedIn post on this ranking.
Why the US still tops the largest natural gas producers
Indeed, US output of 1,073.7 bcm was 25.6% of the world total. In other words, the United States supplied just over a quarter of the world’s gas. On the Energy Institute’s figures, US output rose 4.3% in 2025. By contrast, Russia slipped 3.0% to 609.4 bcm.
The US Energy Information Administration records 39,288 bcf of dry gas in 2025. On its own basis, that is about 1,112 bcm. The gap reflects the Energy Institute’s 40 MJ/m3 standard, not a change of rank. In particular, the EIA has ranked the US as the largest gas producer since 2011.
Appalachia, the Permian and the Haynesville supplied 67% of US marketed output in 2025. Moreover, those three plays accounted for 81% of the growth. Marketed output averaged 118.5 bcf/d, on the EIA’s figures. That scale also feeds US LNG exports. For the trade impact, see our analysis of US LNG arbitrage between Europe and Asia.
Iran and China: a 0.7 bcm gap
Meanwhile, Iran held third place at 264.8 bcm, only 0.7 bcm ahead of China. However, China grew 6.6%, against Iran’s 1.3%. As a result, the two countries now share a 6.3% slice of world output.
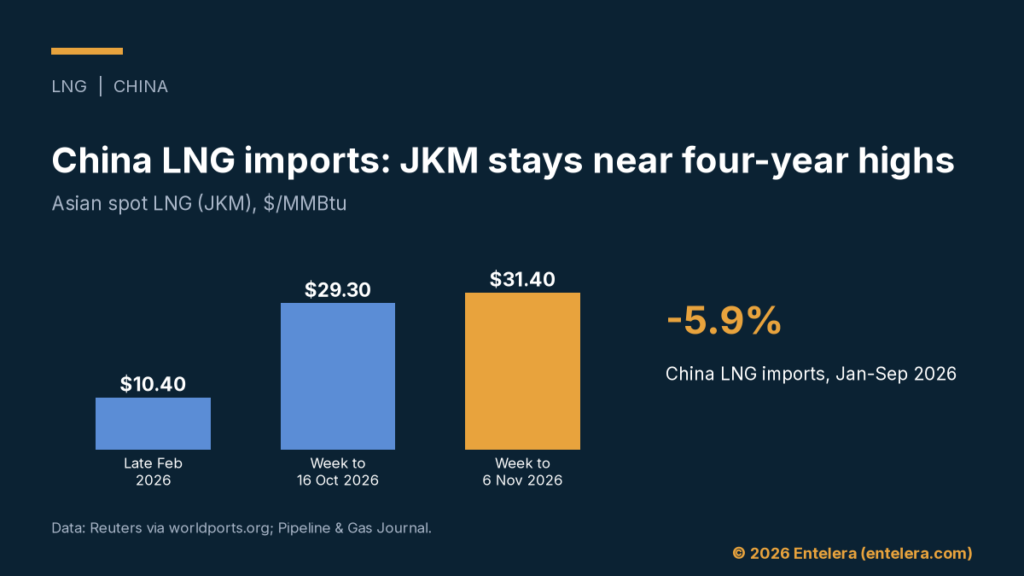
China’s production was 136 bcm in 2015, on the Energy Institute’s figures. So output has almost doubled in a decade. Even so, imports still made up 37% of China’s gas consumption in 2025. For the import mix, see our analysis of China’s LNG imports and Bohai gas.
Who grew, and who fell, in 2025
Still, Saudi Arabia recorded the fastest rise in the top 10, at 8.5%, to 133.8 bcm. Canada grew 3.7% to 206.2 bcm, and held fifth place. Qatar rose 2.4% to 183.5 bcm, and stayed sixth. For Qatar’s role in traded LNG, see our analysis of the Qatar LNG supply gap.
However, three producers in the top 10 saw output fall. Australia declined 2.2% to 148.6 bcm. Norway fell 2.7% to 120.6 bcm. Algeria slipped 1.9% to 98.0 bcm. Malaysia, in 11th place at 80.2 bcm, remained outside the top 10. For the European market context, see our analysis of TTF gas prices and tight storage.
What the largest natural gas producers tell traders
In short, the list of the largest natural gas producers maps concentration for the trading desk. Indeed, the top 10 already supply nearly three-quarters of the world’s gas. Therefore, a swing in US output, or a further rise in China, moves the global balance. Likewise, a sister ranking of the biggest oil producers in 2025 shows a similar concentration. There, the oil top 10 held 73.8% of world supply.
However, the near-term gas story is not only about the leader. The 0.7 bcm gap between Iran and China is narrow, after China’s 6.6% rise. Prompt gas and LNG spreads then reflect that balance of growth, not only the headline production rank.
What to watch next
- First, monthly EIA dry-gas data, for signs that US growth is holding.
- Second, China’s import share, which was still 37% of consumption in 2025.
- Finally, output from Norway and Qatar, which matter most for European and LNG prices.
Sources
- Energy Institute, Statistical Review of World Energy 2026, 75th edition, 30 June 2026: energyinst.org
- Energy Institute, Statistical Review of World Energy 2026, natural gas production table (PDF): kpmg.com
- EIA, US dry natural gas production, annual: eia.gov
- US Energy Information Administration, Appalachia, Permian and Haynesville drive US gas growth, 2026: eia.gov
- Today in Energy, the US has been the world’s largest natural gas producer since 2011, 2026: eia.gov