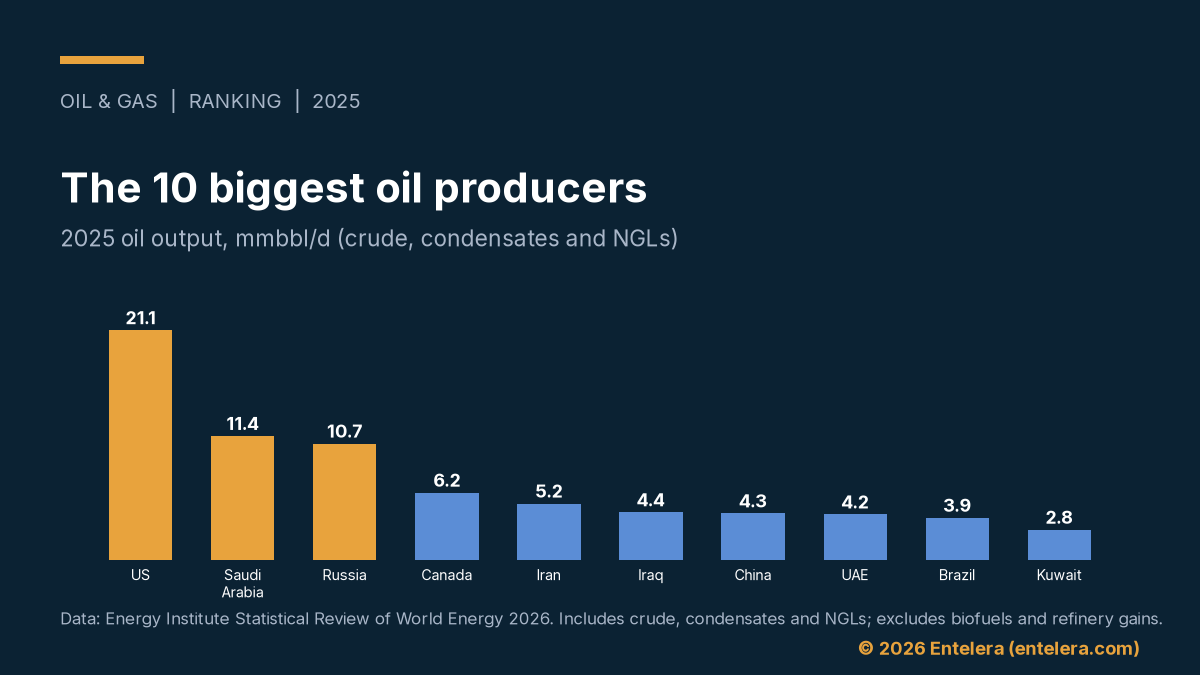
The United States led the biggest oil producers in 2025, at 21.1 mmbbl/d. Saudi Arabia followed at 11.4 mmbbl/d, and Russia at 10.7 mmbbl/d. Overall, the top 10 pumped 74.2 mmbbl/d, or 73.8% of world supply.
To begin with, we ranked countries by calendar-year average output. The source is the Energy Institute Statistical Review of World Energy 2026, released on 30 June 2026. Specifically, the measure includes crude oil, shale oil, oil sands, condensates and NGLs. By contrast, it excludes biofuels, liquids from coal or gas, and refinery processing gains. World output was 100.6 mmbbl/d, up 3.5% on 2024.
The ranked table of the biggest oil producers
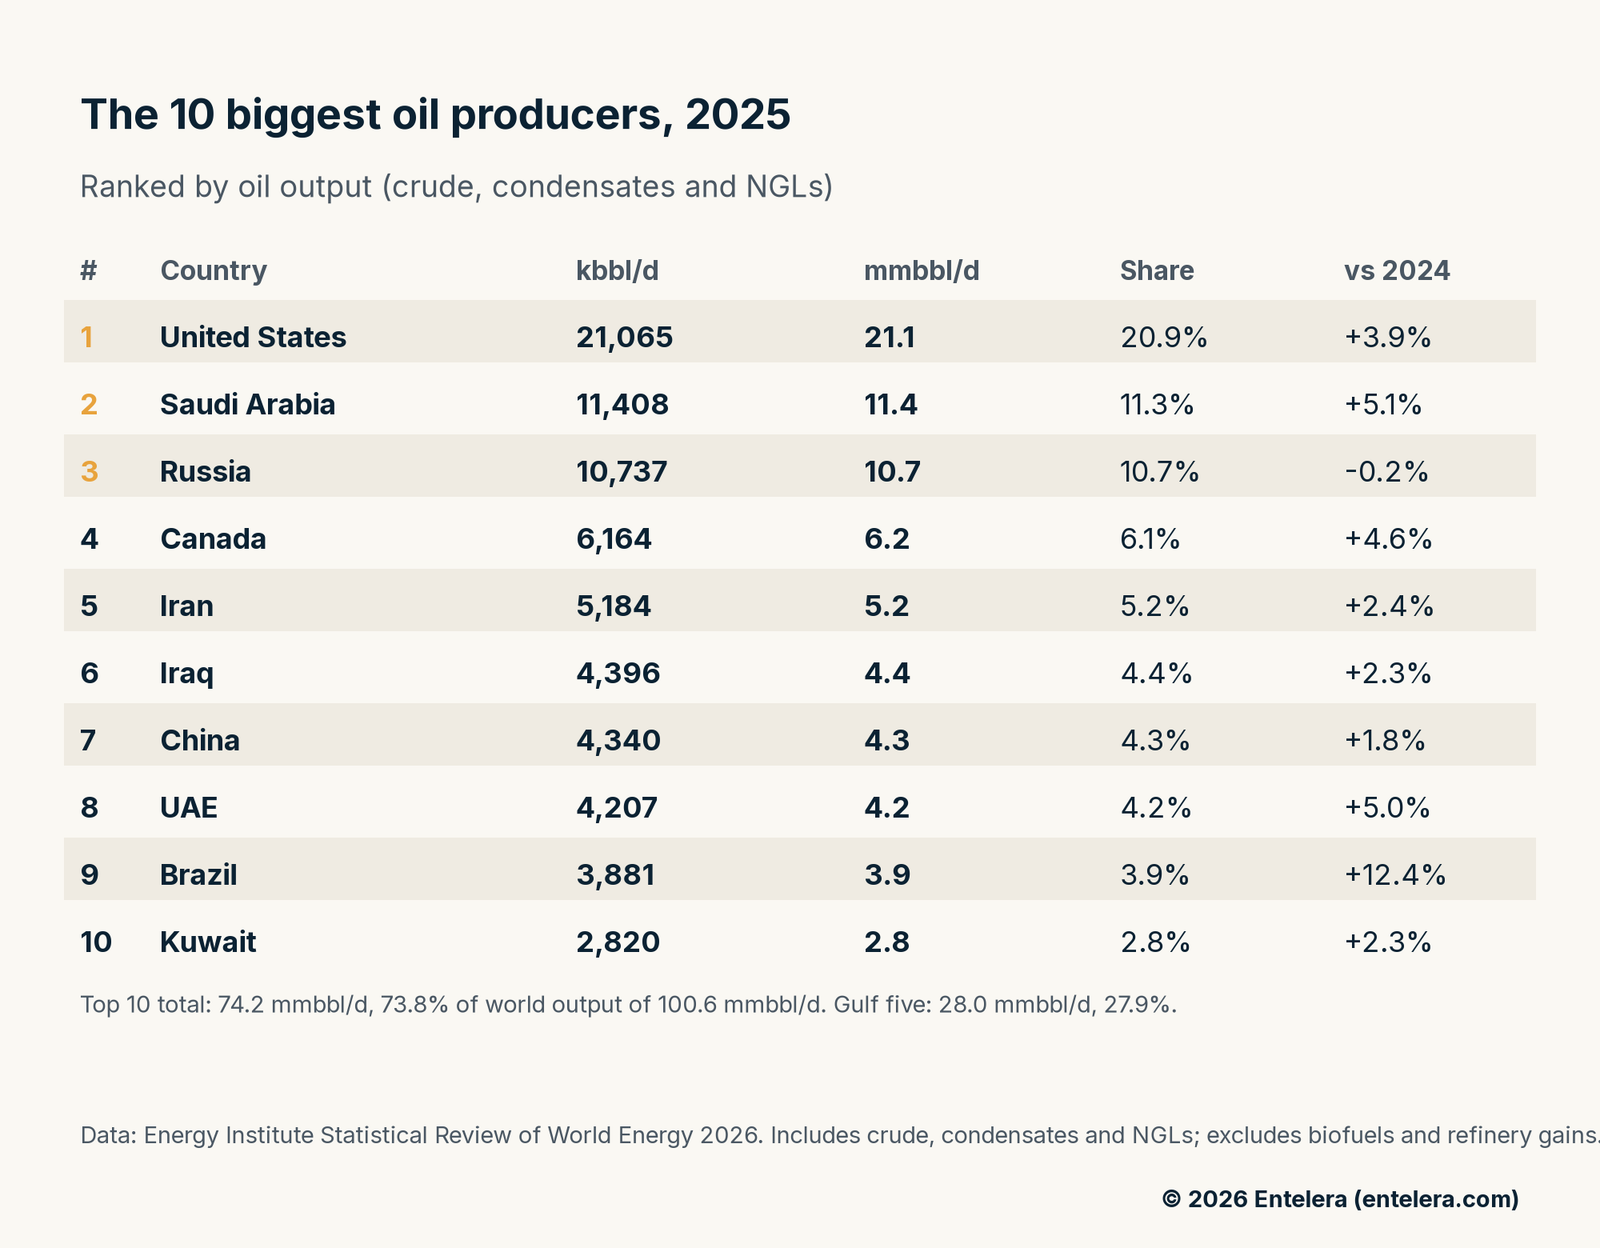
- 1) United States: 21.1 mmbbl/d, 20.9% of world output, up 3.9%.
- 2) Saudi Arabia: 11.4 mmbbl/d, 11.3%, up 5.1%.
- 3) Russia: 10.7 mmbbl/d, 10.7%, down 0.2%.
- 4) Canada: 6.2 mmbbl/d, 6.1%, up 4.6%.
- 5) Iran: 5.2 mmbbl/d, 5.2%, up 2.4%.
- 6) Iraq: 4.4 mmbbl/d, 4.4%, up 2.3%.
- 7) China: 4.3 mmbbl/d, 4.3%, up 1.8%.
- 8) UAE: 4.2 mmbbl/d, 4.2%, up 5.0%.
- 9) Brazil: 3.9 mmbbl/d, 3.9%, up 12.4%.
- 10) Kuwait: 2.8 mmbbl/d, 2.8%, up 2.3%.
In fact, the United States almost matched Saudi Arabia and Russia combined, at 22.1 mmbbl/d. Further, the same ranking is in the Entelera LinkedIn post on this ranking.
Why the US still tops the biggest oil producers
Indeed, US output of 21.1 mmbbl/d was about 21% of the world total, as the Energy Institute notes. That scale comes from tight oil and from NGLs, which this measure includes. As a result, the US lead is wider here than in crude-only tallies.
On the Energy Institute’s figures, the US also added the most barrels among the biggest oil producers in 2025. In particular, output rose 3.9%, a gain of 0.8 mmbbl/d. By contrast, Russia slipped 0.2% to 10.7 mmbbl/d.
Five Gulf producers, and the Hormuz risk
Meanwhile, five of the top 10 are Gulf producers: Saudi Arabia, Iran, Iraq, the UAE and Kuwait. So they pumped 28.0 mmbbl/d, or 27.9% of world supply. The Energy Institute flags the risk to this supply when the Strait of Hormuz closed in late February 2026.
Saudi Arabia raised output by 5.1%, the second-fastest rise in the top 10. Similarly, the UAE was just behind, at 5.0%. Iran grew 2.4%, while Iraq and Kuwait each grew 2.3%. In other words, the Gulf added barrels in 2025, then saw its export routes tested in early 2026. For the flow detail, see our analysis of Strait of Hormuz flows versus Asia’s crude arrivals.
Brazil grew fastest among the top 10
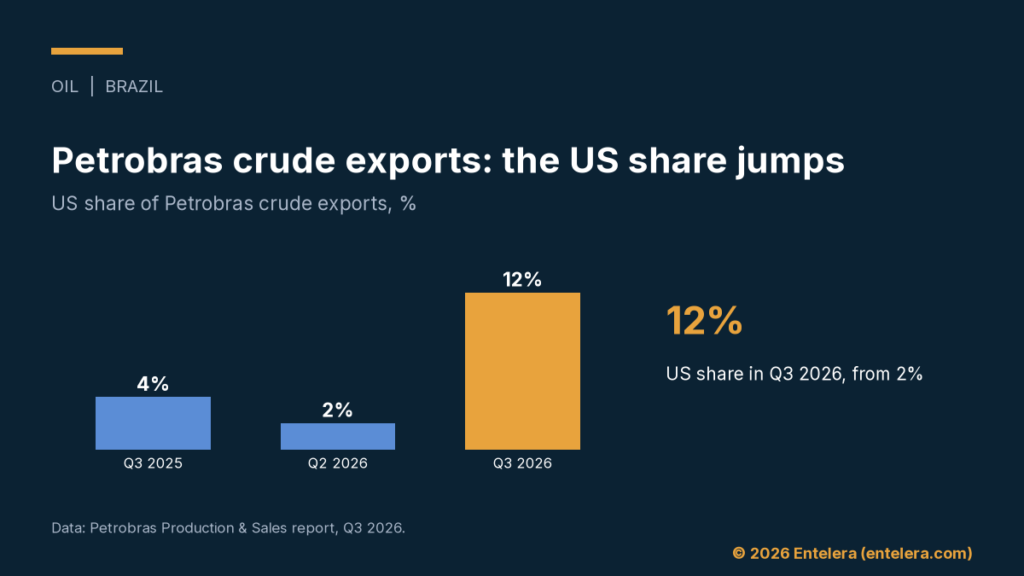
Still, Brazil’s output rose 12.4% to 3.9 mmbbl/d, the sharpest gain in the top 10. At the same time, Canada rose 4.6% to 6.2 mmbbl/d, and held fourth place. Finally, China grew 1.8% to 4.3 mmbbl/d, just ahead of the UAE.
What the biggest oil producers tell traders
In short, the list of the biggest oil producers maps concentration and route risk for the trading desk. Indeed, the top 10 already supply nearly three-quarters of the world’s oil. Therefore, a shock in the Gulf, or a swing in US output, moves the global balance.
However, the more immediate risk sits with the Gulf five. Their 28.0 mmbbl/d has to find a way out when Hormuz shuts. Prompt spreads then reflect tanker and bypass capacity, not only the headline production rank.
Spare capacity is the other lever. In addition, August 2026 OPEC+ output sat about 5 mmbbl/d below the February 2026 level. Moreover, it sat about 6 mmbbl/d below target, on our reading of OPEC data. Those shut-in barrels are the spare that would return if Hormuz reopened. We set that out in our analysis of the oil supply overhang.
What to watch next
- First, monthly OPEC production data and Gulf loadings, for signs that shut-in barrels are returning.
- Second, the OPEC+ meeting on 29 November 2026, which may signal 2027 quotas.
- Finally, Hormuz transits and the bypass pipelines, which decide how much of the Gulf five can actually sail.
Sources
- Energy Institute, Statistical Review of World Energy 2026, 75th edition, 30 June 2026: energyinst.org
- Energy Institute, Statistical Review of World Energy 2026, oil production table (PDF): kpmg.com
- Institute for Energy Research, Fossil Fuels Dominate Global Energy Supply in 2025, 2026: instituteforenergyresearch.org