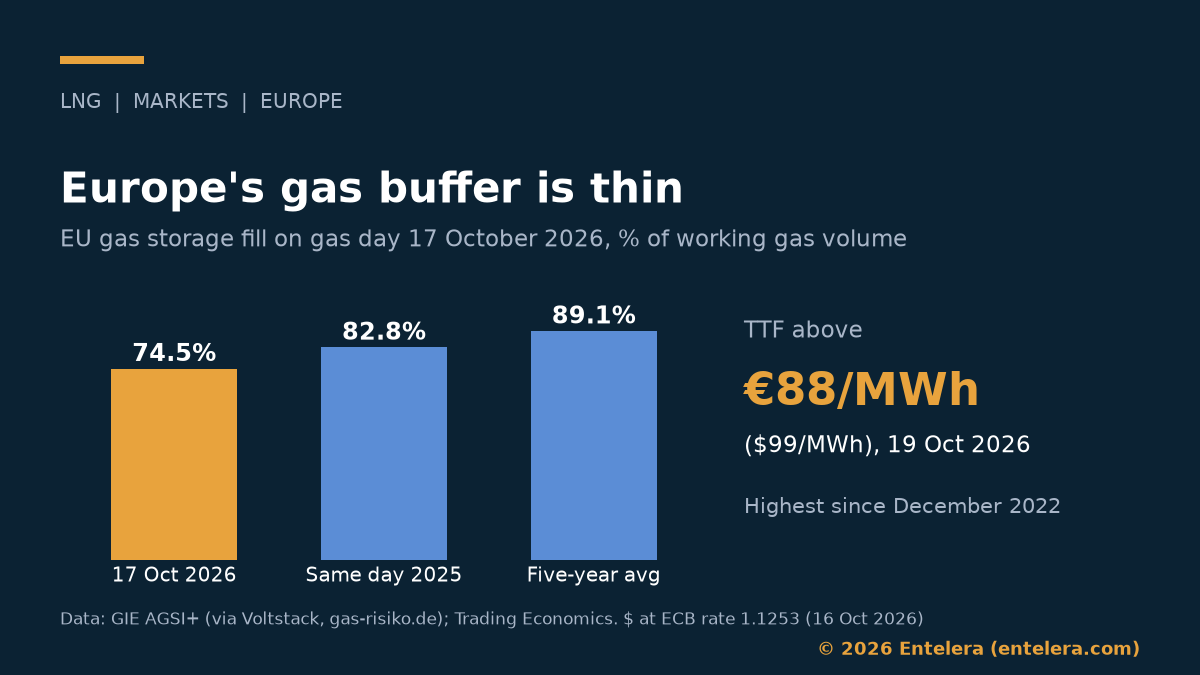
EU gas storage was 74.5% full on gas day 17 October 2026, according to GIE AGSI+ data. A year earlier, the same day showed 82.8%. The five-year average is about 89%. Meanwhile, the Dutch TTF benchmark rose above €88/MWh ($99/MWh) on 19 October, its highest level since December 2022.
This analysis looks at where the storage gap sits and why Europe struggles to refill. It also asks what this means for buyers in Asia, including India. Unless stated otherwise, we convert euros at the European Central Bank (ECB) reference rate of $1.1253 for 16 October 2026. That was the latest rate at the time of writing.
How full is EU gas storage?
On gas day 17 October, the EU held about 844 TWh of gas against a working capacity of 1,133 TWh. That is roughly 79 bcm in store, using the Oxford Institute for Energy Studies (OIES) ratio of about 10.7 TWh per bcm. Over the previous seven days, the fill rose by only 0.8 points.
In other words, EU gas storage is about 94 TWh, or roughly 8.8 bcm, behind last year. Using AGSI+ data for 16 October, Oil Authority put the gap at about 92 LNG cargoes of 1.1 TWh each. The start of the season set the tone. ENTSOG, the network of gas grid operators, says storage was 72% full on 1 October, against 83% a year earlier.
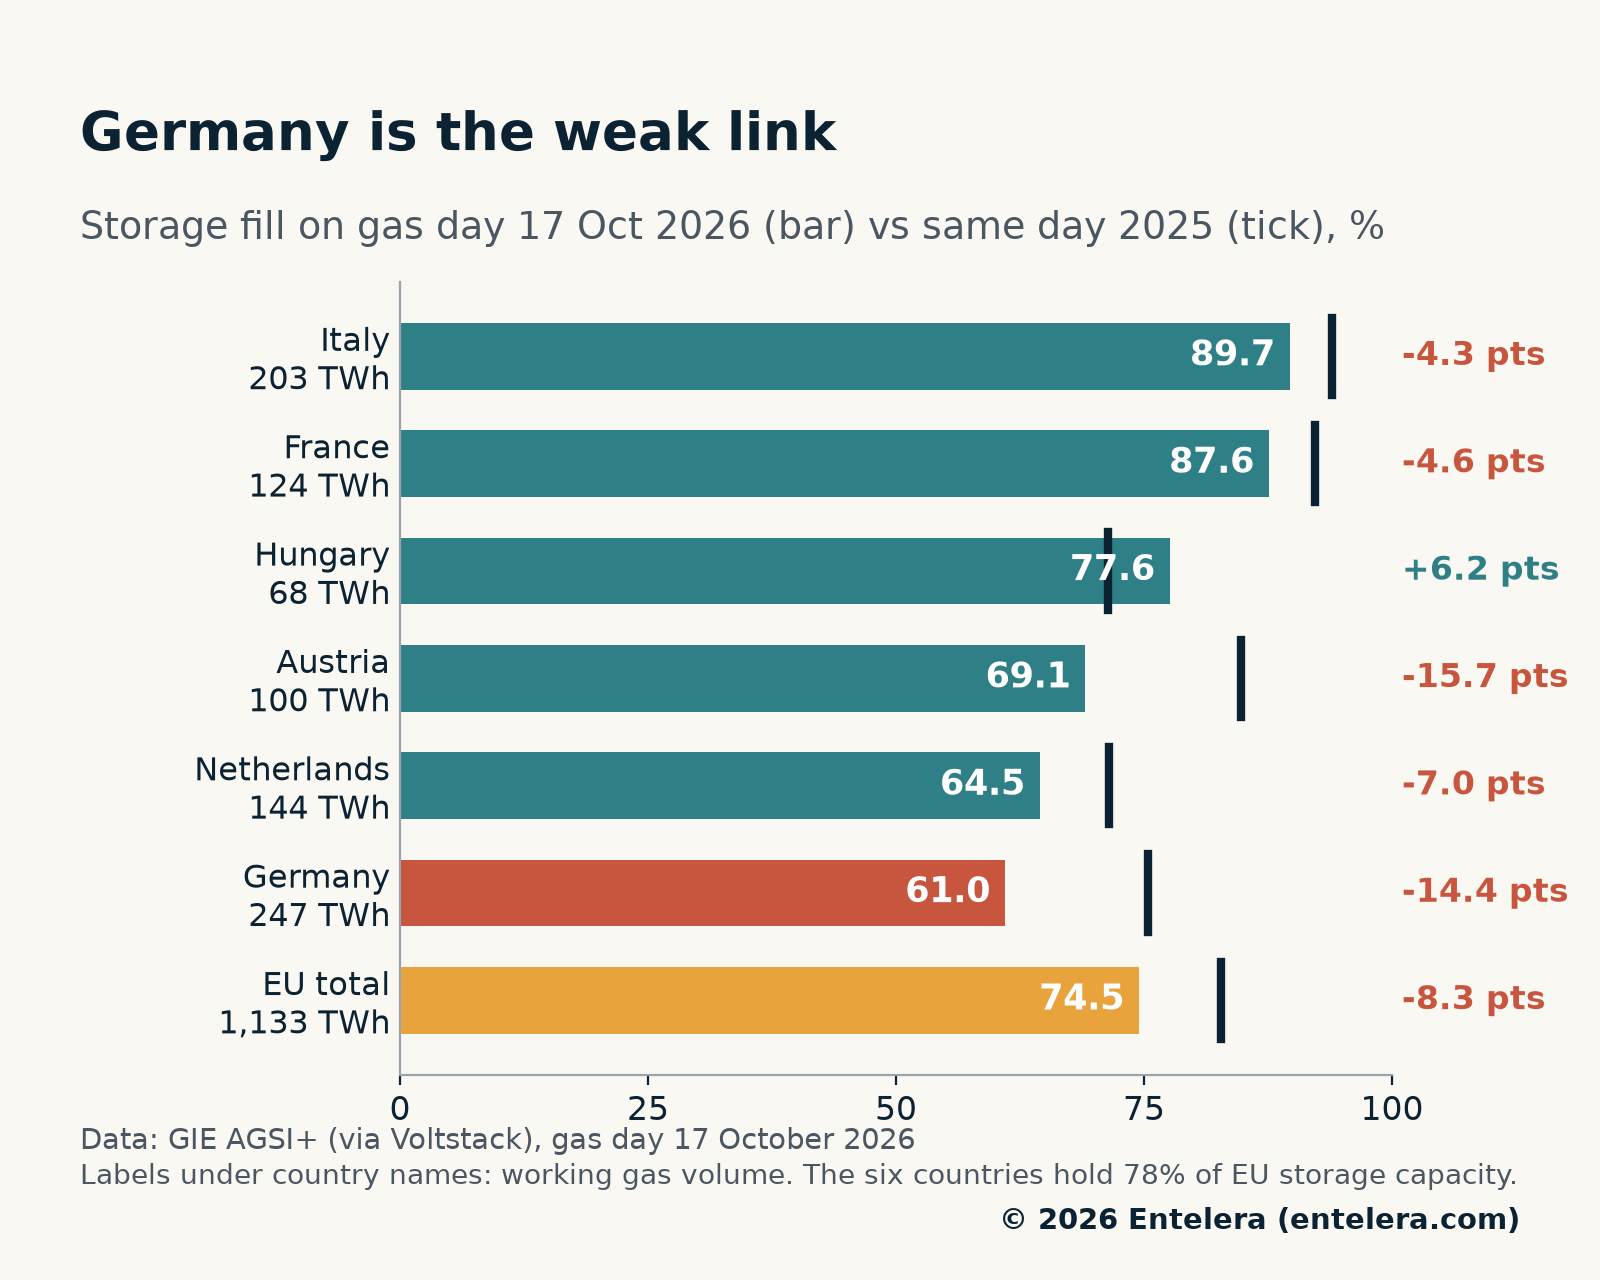
Germany is the weak link in EU gas storage
Germany has the EU’s largest storage capacity, at 247 TWh, or 22% of the total. Yet it was only 61.0% full on 17 October, the lowest of the six biggest storage countries. That is 14.4 points below last year and 26.8 points below its five-year average.
Fill levels vary widely across the six. Italy was 89.7% full and France 87.6%. By contrast, Austria stood at 69.1% and the Netherlands at 64.5%. Hungary was the only one of the six above last year’s level, at 77.6%.
Rechecking Germany’s share of the gap
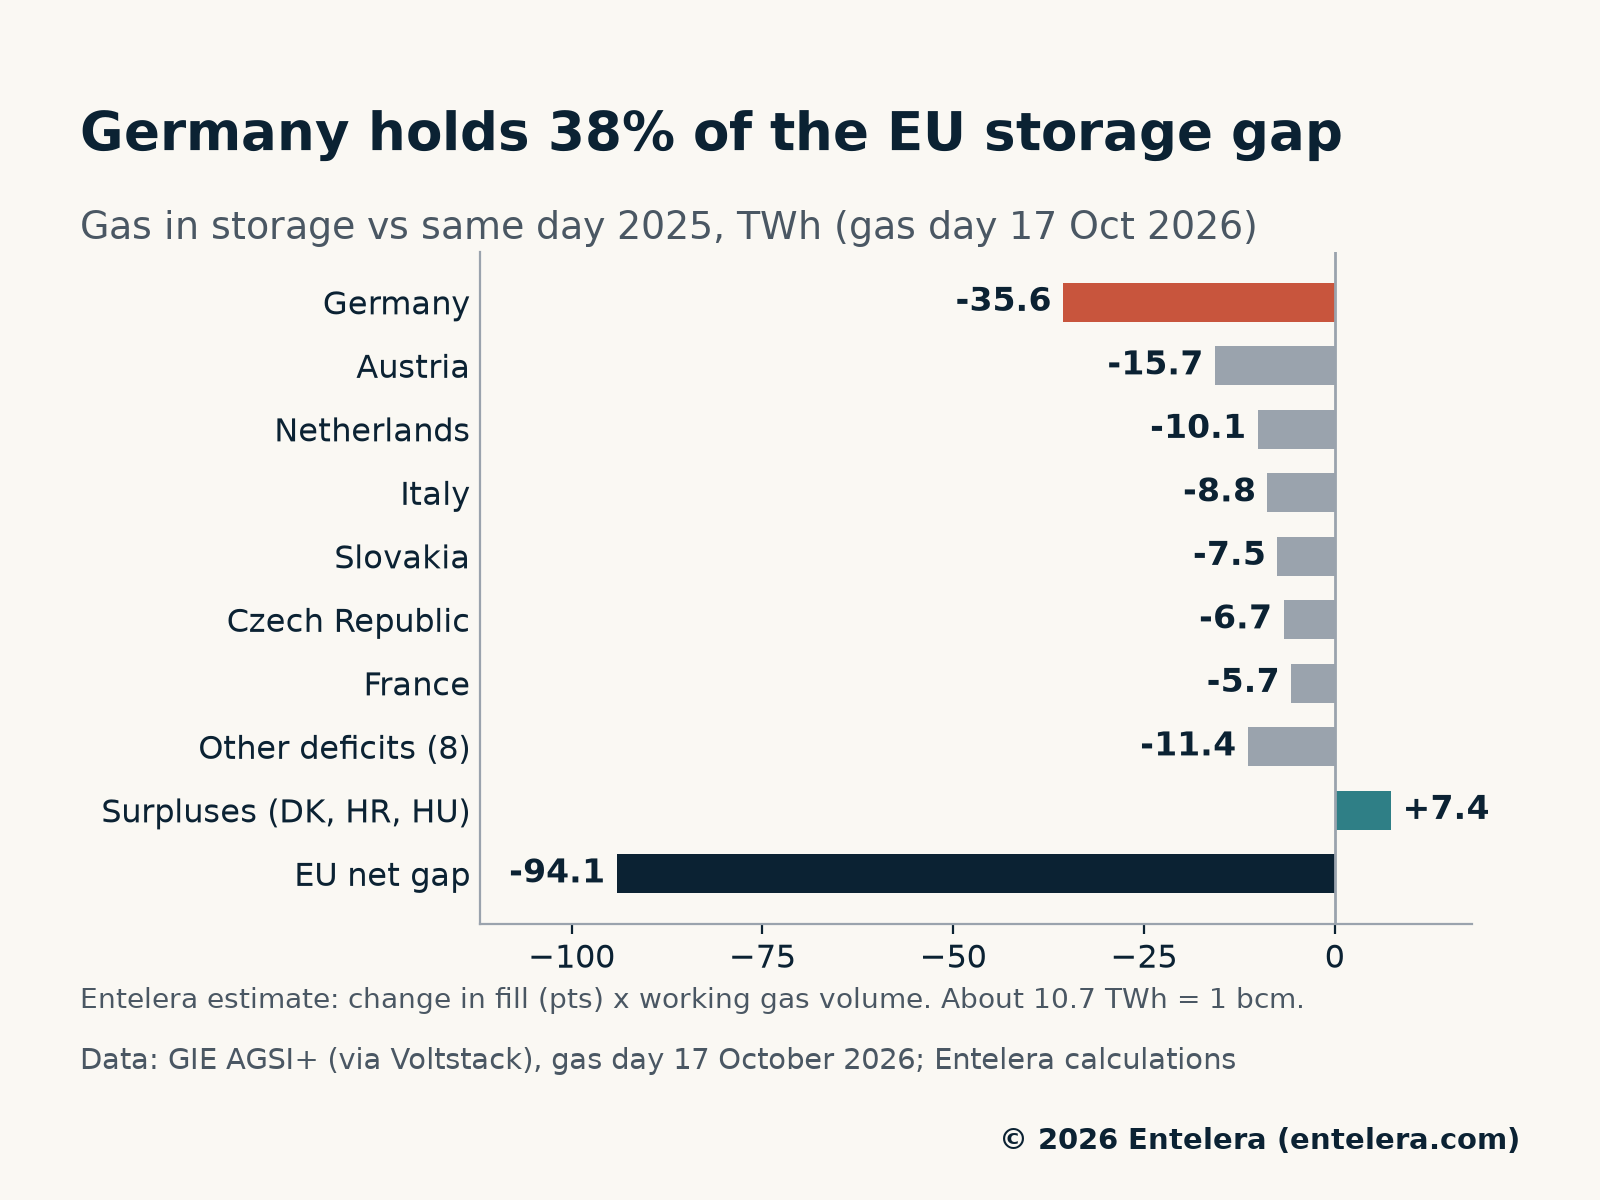
We rechecked the estimate from the LinkedIn post, which put Germany at about 38% of the EU’s shortfall. Multiplying each country’s change in fill by its capacity gives Germany about 35.6 TWh of the 94.1 TWh net gap. So the figure holds at about 38%.
However, the answer depends on the method. Denmark, Croatia and Hungary hold about 7.4 TWh more than last year, which shrinks the net gap. Against the gross deficit of the countries below last year, about 101.5 TWh, Germany’s share is about 35%. Together, Germany, Austria and the Netherlands make up about 65% of the net gap. Both figures are Entelera estimates and assume that capacity has not changed since last year.
Why TTF is at a four-year high
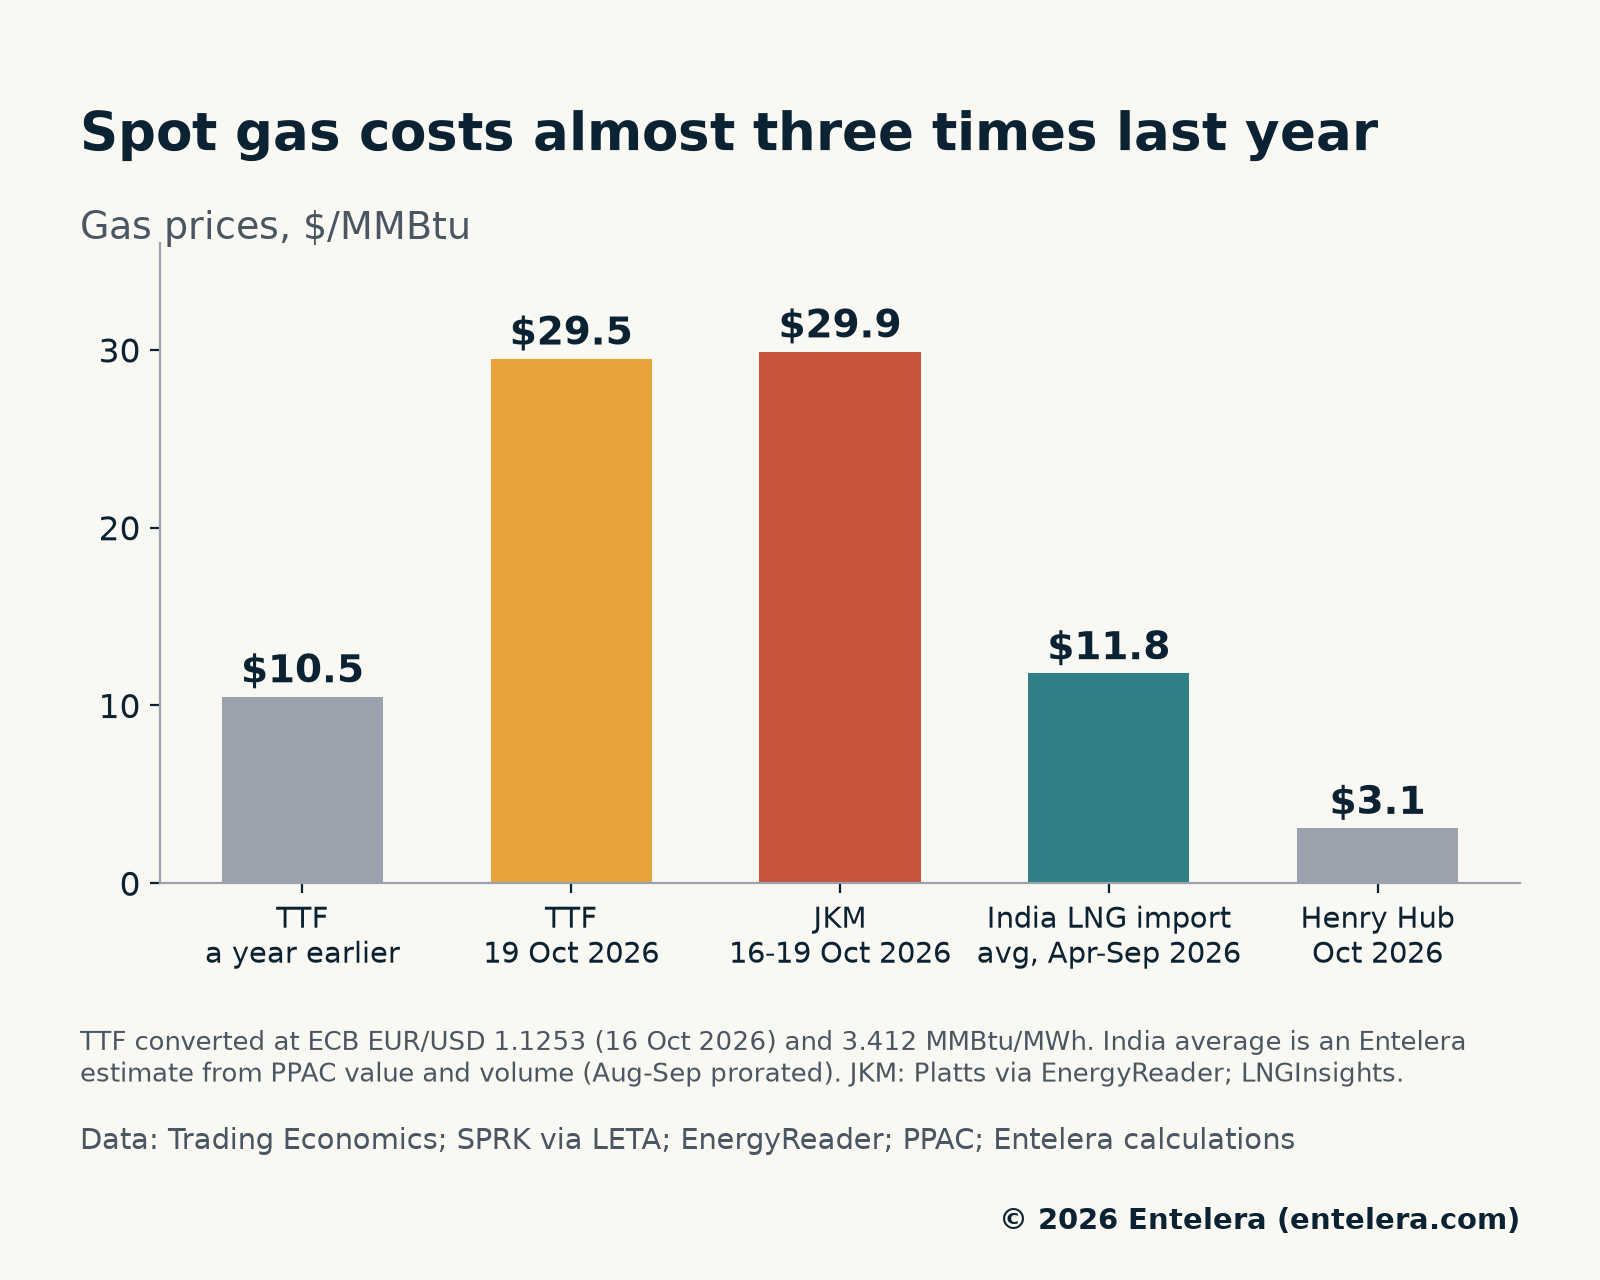
Trading Economics shows TTF at €89.57/MWh ($100.79/MWh) on 19 October, up 2.31% on the day. That is about $29.5/MMBtu. A year earlier, the price was about €31.7/MWh ($35.7/MWh), Latvia’s regulator SPRK reported. So gas now costs about 2.8 times as much.
The rally has built over months. According to OIES, front-month TTF traded mostly at €40-50/MWh ($45-56/MWh) in the second quarter. Then it reached a peak of €83.53/MWh ($94.00/MWh) in mid-September. For context, the ten-year average to 1 October 2026 was €39.63/MWh ($44.60/MWh).
The market expects some relief after winter. On EEX, the front-month contract settled at €87.54/MWh ($98.51/MWh), EnergyReader reported on 19 October. By contrast, calendar-2027 settled at €70.96/MWh ($79.85/MWh). This forward-curve figure comes from a single source.
Hormuz keeps Gulf LNG off the market
The main cause sits far from Europe. About 93% of Qatar’s LNG exports and 96% of the UAE’s pass through the Strait of Hormuz, according to the International Energy Agency (IEA). In 2025, that came to just over 112 bcm, or almost 20% of global LNG trade. There is no other route for this gas.
Those flows remain far below normal. OIES says Qatar and UAE exports are just above 2 bcm a month, against more than 10 bcm before the crisis. Moreover, about half of that stays in the Gulf, mainly in Kuwait. QatarEnergy has also extended force majeure through November for some buyers. For the oil side of the story, see our Strait of Hormuz analysis.
Kpler data, cited by Gas Processing & LNG, show Qatar exported 1.6mn t of LNG in September. Even so, that was less than a quarter of the pre-war average. Kpler expects October exports to fall to about 0.6mn t. These monthly figures rest on a single ship-tracking source.
Asia and Europe chase the same cargoes
Europe took only about 7% of its LNG from Hormuz in 2025, the IEA estimates. In contrast, Asia took about 27% of its LNG from that route. So Asian buyers now look elsewhere, mainly to the Atlantic cargoes that Europe also needs.
As a result, the two benchmarks have converged. Platts JKM, the main Asian spot price, was $29.93/MMBtu, EnergyReader reported. Similarly, LNGInsights put JKM at $29.89/MMBtu on 16 October. That is less than $1/MMBtu above TTF. In our view, Europe cannot simply outbid Asia, and neither side can buy its way out of a global shortfall.
The shortfall shows in the data. According to OIES, Qatar’s LNG fell by 20.8 bcm year-on-year in the third quarter, while supply from elsewhere rose by 13.5 bcm. As a result, global LNG imports fell 5.4%. Europe’s LNG imports fell to a two-year low, so less gas went into storage.
Can EU gas storage still meet its target?
EU rules require each member state to reach 90% at any point between 1 October and 1 December. However, since 2025, countries may fall short by up to 10 points in difficult market conditions. The Commission can allow a further five points. In March 2026, the EU energy commissioner also invited member states to use that flexibility and aim for 80%, a European Parliament answer shows.
On the EU-wide total, reaching 80% would need about 62 TWh more, or roughly 5.8 bcm. At last week’s pace of 0.8 points, that would take about seven weeks. Yet net injections usually stop by early November. OIES notes that net injections in October 2025 were only 0.26 bcm. Writing in early October, it judged that stocks might be below 75% on 1 November.
For Germany, the climb is steeper. Reaching 80% would need about 47 TWh more. At its recent pace of 0.9 points a week, that would take about five months. These are Entelera estimates, not forecasts.
Winter risks for EU gas storage
Low stocks do not mean Europe will run out of gas. The Commission’s Gas Coordination Group said on 8 October that the system is flexible enough to meet demand. Europe also has about 145 bcm of LNG import capacity per winter, Gas Infrastructure Europe (GIE) says.
Even so, the buffer is thin. ENTSOG’s tight-LNG case leaves storage just 13% full by the end of March 2027 in a normal winter. To end winter at 30%, Europe would need about 96 bcm of LNG. Then, a cold spell would draw stocks down faster and could lift prices further.
Analysts see room for more gains. Global Risk Management thinks TTF could reach €100/MWh ($112.53/MWh) if conditions worsen, Oil Authority reported. Bloomberg Intelligence sees €102/MWh ($114.78/MWh), according to ABC.AZ. That second forecast comes from a single report.
Policy adds another squeeze. Under EU Regulation 2026/261, imports of Russian LNG under existing long-term contracts must stop from 1 January 2027. The ban on short-term contracts already applied from 25 April 2026. So EU gas storage will have to be rebuilt next summer without that supply.
What it means for India’s spot LNG buyers
India imports about half of its gas. In April-September, PPAC data show LNG imports of 18.2 bcm, or about 13.7mn t, up 4.5%. Meanwhile, the LNG bill rose 23% to $8.5bn, and import dependence for gas rose to 52.3%.
Dividing the bill by volume gives an average cost of about $11.8/MMBtu, against about $10.0 a year earlier. This Entelera estimate uses PPAC conversion factors, and PPAC prorates the August and September data. In our view, the low average suggests that term contracts still supply most of India’s LNG.
Spot cargoes are a different matter. At $30/MMBtu, every extra 1mn t of spot LNG costs about $1.6bn, against about $0.6bn at India’s H1 average. Indian importers have been buying spot cargoes at very high prices, the Indian Express reported. Until the crisis, Qatar was India’s largest supplier.
The supply mix has shifted sharply. Kpler data, quoted by the Indian Express, show imports from Qatar fell 88.5% year-on-year to 0.1mn t in September. Instead, Oman and Nigeria topped the list. About 60% of India’s LNG used to pass through Hormuz, the paper said, a single-source figure.
In our view, Europe’s storage gap is also India’s price risk. If Europe has a cold winter, it will bid hard for Atlantic cargoes. Then, price-sensitive Indian users, such as power plants, may have to pay near-record prices or cut gas use. Our India crude import bill analysis shows the same pressure on oil.
What to watch next
- Daily GIE AGSI+ data, for the date when the EU switches from net injection to net withdrawal.
- Germany’s fill level, the largest single drag on EU gas storage.
- Weather forecasts for November, since a cold spell would draw stocks down faster.
- Gulf LNG cargoes through Hormuz and any change to QatarEnergy’s force majeure.
- The JKM-TTF spread, which decides whether Atlantic cargoes head to Asia or Europe.
- PPAC’s next snapshot, for India’s October LNG import bill.
In short, Europe is not out of gas, but it is short of buffer. Our news report on the TTF rally has the key numbers at a glance.
Sources
- GIE AGSI+ storage data, gas day 17 October 2026: agsi.gie.eu
- Voltstack, EU Gas Storage Map (AGSI+ data): voltstack.energy
- gas-risiko.de, EU gas storage levels (AGSI+ data): gas-risiko.de
- Gas Infrastructure Europe, winter storage release, 9 October 2026: gie.eu
- ENTSOG, Winter Supply Outlook 2026/27: entsog.eu (PDF)
- European Commission, Gas Coordination Group, 8 October 2026: energy.ec.europa.eu
- Regulation (EU) 2025/1733 on gas storage targets: eur-lex.europa.eu
- European Parliament, answer E-001344/2026 on storage flexibility: europarl.europa.eu
- Regulation (EU) 2026/261 on Russian gas imports: eur-lex.europa.eu
- Trading Economics, EU Natural Gas TTF, 19 October 2026: tradingeconomics.com
- ABC.AZ (Fineko), 19 October 2026: abc.az
- TVNET/LETA, citing SPRK, 19 October 2026: tvnet.lv
- EnergyReader, daily briefing, 19 October 2026: energyreader.io
- Oil Authority, EU storage and LNG cargoes, 18 October 2026: oilauthority.com
- IEA, Strait of Hormuz 2026 factsheet: iea.org (PDF)
- OIES, Quarterly Gas Market Review, Issue 34, October 2026: oxfordenergy.org (PDF)
- Gas Processing & LNG (Kpler data), October 2026: gasprocessingnews.com
- The Indian Express (Kpler data), 14 October 2026: indianexpress.com
- PPAC, Snapshot of India’s Oil & Gas data, October 2026: ppac.gov.in (PDF)
- ECB, euro reference rate vs US dollar, 16 October 2026: ecb.europa.eu