Reports Oil & Gas

Report · Oil & Gas

Petrobras Q3 2026 results: financial summary

Petrobras made $7.7bn of net income in Q3 2026, up 28% on Q3 2025, on record oil and gas output of 3.51mmboe/d and record exports. Profit, cash, debt, dividends, segments, production and the raised 2026 guidance, from the company’s own results.

By Entelera Research

Summary

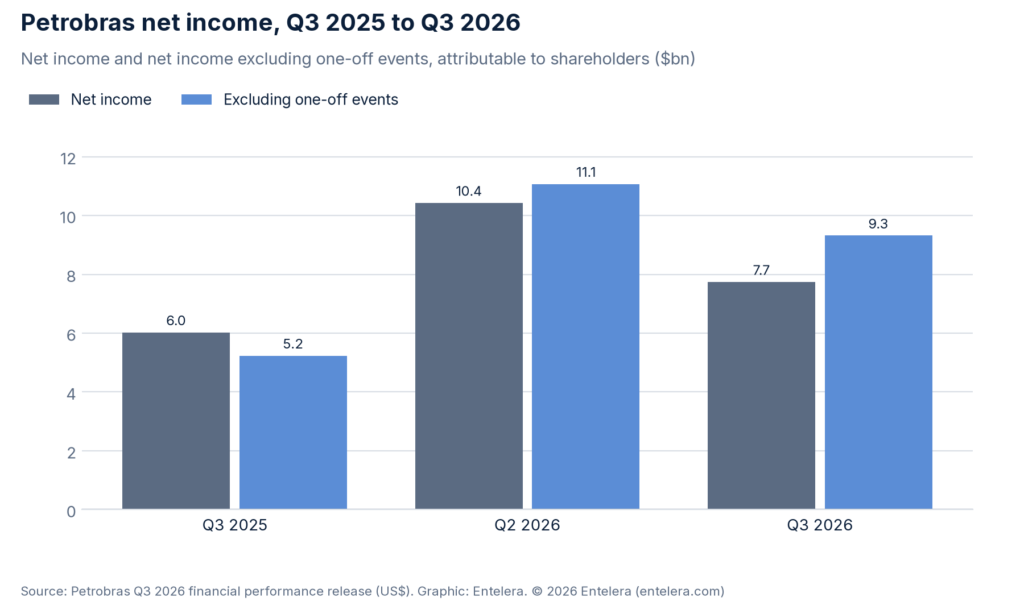
Petrobras reported net income attributable to shareholders of $7.74bn for Q3 2026 on 10 November 2026, up 28% on the $6.03bn of Q3 2025 but 26% below the $10.43bn of Q2 2026. Excluding what Petrobras calls one-off events, net income was $9.32bn, up 78% on Q3 2025. The one-off events cost $2.39bn before tax: an $867mn export tax on crude oil and diesel, $818mn of losses on legal proceedings and a $710mn charge linked to the 2019 sale of the TAG gas pipeline network.

Key numberQ3 2026Change
Net income$7.7bn+28% vs Q3 2025; -26% vs Q2 2026
Adjusted EBITDA$16.7bn+42% vs Q3 2025; -10% vs Q2 2026
Free cash flow$6.6bn+33% vs Q3 2025; -14% vs Q2 2026
Total own production3.51mmboe/d+12% vs Q3 2025; a record
Source: Petrobras Q3 2026 financial performance release (US$).

The free summary and the full 11-page report ($33) are on the report page: use “Buy full report” above.

Tell us what you’d like to see

Tell Entelera Research what was useful in this report and what we should add or change. It takes under a minute.
Report: Petrobras Q3 2026 results report

How useful was it? (1 = not useful, 5 = very useful)


We read every response. Your feedback is stored by Entelera and not shared.

Key findings

  • Net income of $7.7bn in Q3 2026, up 28% on Q3 2025; $9.3bn excluding one-off events, up 78%.
  • Record own production of 3.51mmboe/d and record exports of 1,251kbbl/d; 140kbbl/d of crude still in transit will be booked in Q4 2026.
  • Refining, transportation and marketing adjusted EBITDA of $5.9bn, 4.6 times Q3 2025, with refineries at 99%.
  • Net debt down 4% to $57.8bn, 1.00 times 12-month adjusted EBITDA; $2.79bn interim dividend approved.
  • 2026 guidance raised: oil 2.7–2.8mmbbl/d, cash capex $21–22bn and operating cash flow $45–50bn.

Sample chart

Bar chart of Petrobras net income: $6.0bn in Q3 2025, $10.4bn in Q2 2026 and $7.7bn in Q3 2026; excluding one-off events $5.2bn, $11.1bn and $9.3bn
Petrobras’s net income excluding one-off events rose 78% on Q3 2025 to $9.3bn; reported net income of $7.7bn is after $2.39bn of pre-tax one-off costs. Source: Petrobras Q3 2026 financial performance release (US$).

Table of contents

  1. Headline numbers vs the prior quarter and the prior year
  2. Profit: reported and adjusted
  3. Revenue and operating cash flow
  4. Capex, net debt and gearing
  5. Buybacks and dividends
  6. Segment results
  7. Production and throughput
  8. Guidance and outlook
  9. What it means
  10. Notes on the numbers and sources

Methodology

Built only from Petrobras’s own published results documents for the period (results release, financial statements or stock-exchange filing) listed in the Sources section. No broker, consensus or paywalled data. Changes are Entelera calculations from the published figures. Non-US-dollar amounts are converted at the rate stated in the notes.