
Report
Equinor Q3 2026 results report
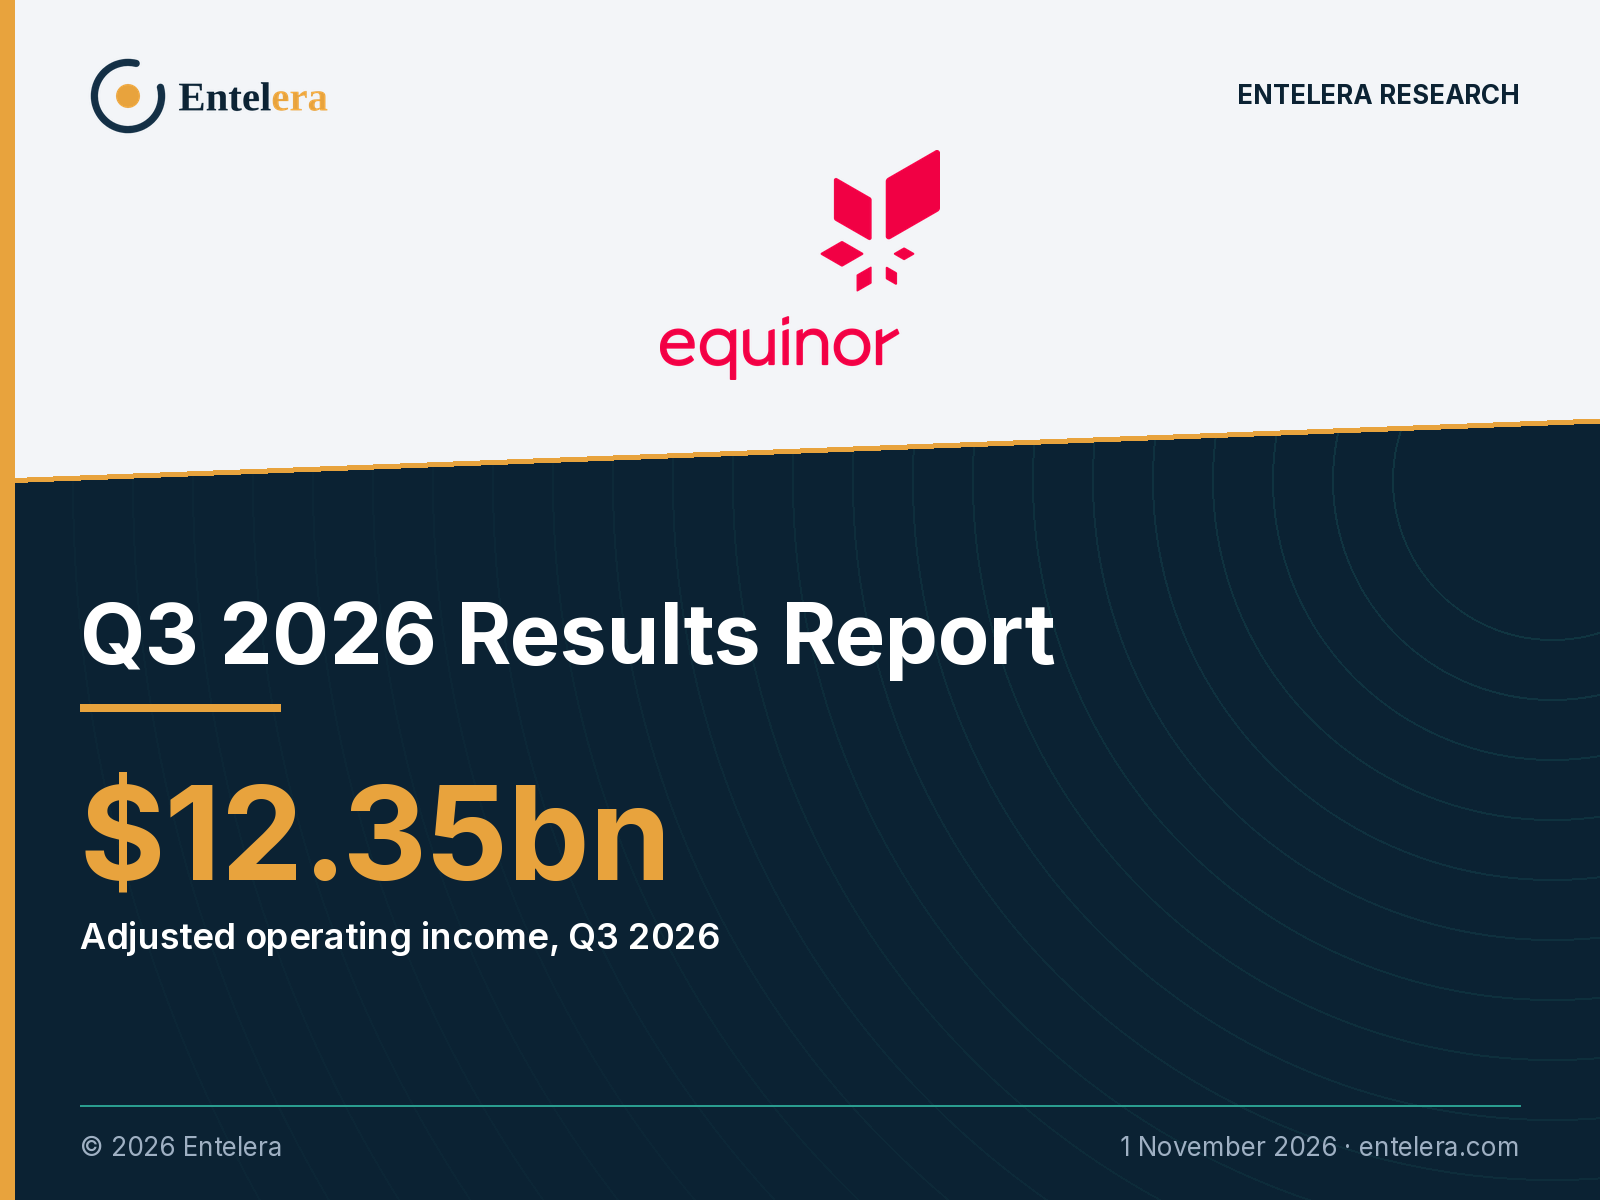
Equinor made $12.35bn of adjusted operating income in Q3 2026, almost double a year earlier, and cut its net debt ratio to 3.8%. Profit, cash, returns and segments, from the company’s own results.
Equinor reported adjusted operating income of $12.35bn for the third quarter of 2026, up 8% on Q2 2026 and 99% on the $6.22bn of Q3 2025. After Norway’s high petroleum taxes, adjusted net income was $2.86bn, or $1.20 a share, and net income was $2.55bn, against a small loss a year earlier.
Higher liquids and European gas prices drove the gain. Equinor realised $92.3/bbl for liquids, against $64.9/bbl a year earlier, and $20.0/MMBtu (per million British thermal units) for European gas. Total equity production was 2.17mmboe/d (million barrels of oil equivalent a day), up 2% year on year.
| Key number | Q3 2026 | Change |
|---|---|---|
| Adjusted operating income | $12.35bn | +8% vs Q2 2026; +99% vs Q3 2025 |
| Adjusted net income | $2.86bn | -11% vs Q2 2026; +207% vs Q3 2025 |
| Cash flow from operations after taxes paid | $8.14bn | +6% vs Q2 2026; +53% vs Q3 2025 |
| Net debt to capital employed (adjusted) | 3.8% | 10.4% at 30 June 2026 |
Cash flow from operations after taxes paid was $8.14bn, even after $6.2bn of Norwegian tax instalments. The net debt ratio fell to 3.8%. Equinor kept its dividend at $0.39 a share and started the fourth tranche, of up to $1.13bn, of a 2026 buyback of up to $3bn.
Looking ahead, Equinor expects organic capex of ~$13bn in 2026 and oil and gas production ~4% higher than in 2025. The fourth buyback tranche runs to no later than 1 February 2027.
Equinor is a gas-heavy, Norway-heavy producer, so its quarter tracks European gas and liquids prices more than refining. Prices lifted operating income by almost 100% on the year, and tax took most of it. The balance sheet is now almost debt-free in adjusted terms, but distributions are fixed for 2026, so any further upside is more likely to show up in 2027 plans than in this year’s buyback.
What the full report covers
The full report is a 6-page PDF for $9.99, available to download straight after payment. It covers:
- Headline numbers against the prior quarter and the prior year
- Profit, reported and adjusted, and what moved it
- Revenue and operating cash flow
- Capex, net debt and gearing
- Buybacks and dividends
- Segment results, with a table and a chart
- Production and throughput
- Guidance and outlook
- What it means
- Notes on the numbers and a full list of sources
The Equinor logo is used only to identify the company this report is about. Entelera Research is independent and has no connection with, or endorsement from, Equinor.
Sources
- Equinor, Financial statements and review, third quarter 2026 (PDF): cdn.equinor.com
This summary is for information only and is not investment advice. It is based solely on the company’s own published results documents listed above; Entelera Research has not audited them. © 2026 Entelera (entelera.com).