
Asia imported 26 million barrels a day (mb/d) of crude in the first half of October. That is within 1% of its pre-war average. On its own, the number suggests the Strait of Hormuz crisis is easing. However, it is not.
This is because the cargoes arriving now left the Gulf in September. Meanwhile, flow data at the strait itself shows a far weaker picture. For importers such as India, arrivals look backwards. Instead, loadings and strait crossings show what comes next.
What the data shows at the Strait of Hormuz
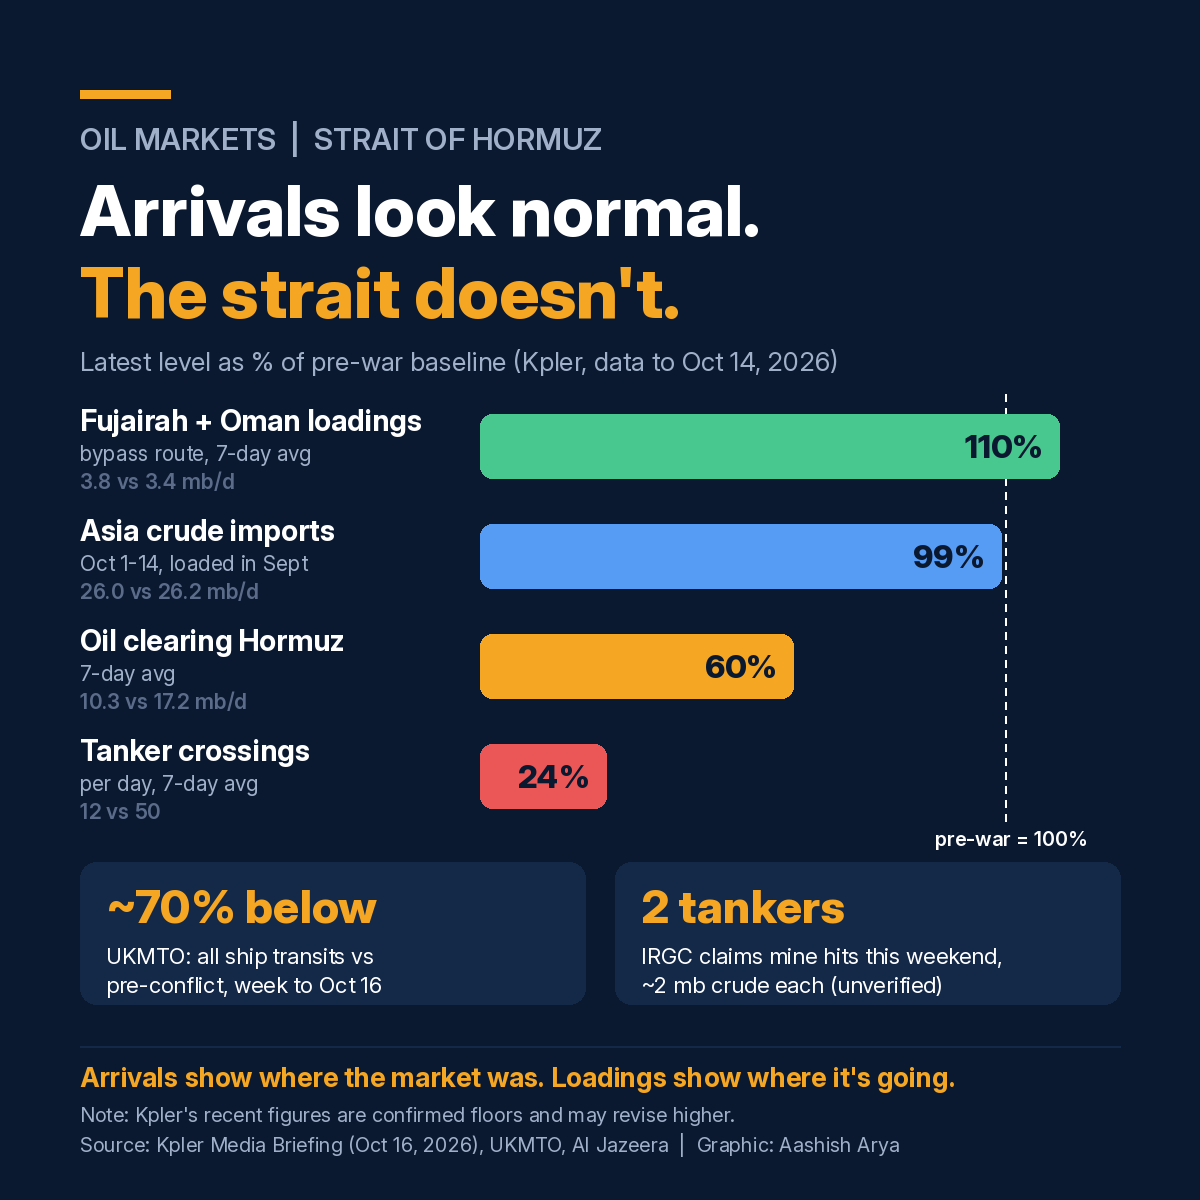
Kpler’s media briefing of 16 October uses flow data to 14 October. It sets out the divergence plainly: “Arrivals in Asia reflect barrels that left the Gulf in September.” In fact, Asia imported 26 mb/d from 1 to 14 October, against a pre-war average of 26.2 mb/d.
At the strait, however, the picture is very different. Kpler’s confirmed Total Hormuz Clearance averaged 10,255 thousand barrels a day (kb/d) over seven days. That is about 40% below the pre-war baseline of 17,175 kb/d. According to Kpler, intensified attacks on commercial vessels sharply cut Gulf crude flows during the week.
Shipping data from UK Maritime Trade Operations (UKMTO) also shows the slump. Its weekly overview for the week ending 16 October reported combined transits of 125 outbound and 129 inbound vessels. That is approximately 70% below pre-conflict levels. UKMTO also recorded 12 attacks that week. Ten were in the Strait of Hormuz, one in the Arabian Gulf and one in the Gulf of Oman.
Over the weekend, accounts diverged sharply. Iran’s Islamic Revolutionary Guard Corps (IRGC) said two tankers caught fire after hitting naval mines. Each was carrying about two million barrels of crude, Al Jazeera reported, citing Iran’s IRNA news agency. By contrast, US Central Command said it had cleared the strait of mines and that projectiles were striking vessels. So far, no one has independently verified either claim.
Strait of Hormuz flows against pre-war levels
Expressed as a share of Kpler’s pre-war baselines, the indicators line up as follows:
- Fujairah and Oman terminal loadings: 3,765 kb/d (seven-day average) against 3,414 kb/d, about 110% of pre-war.
- Asian crude imports, 1-14 October: 26.0 mb/d against 26.2 mb/d, about 99%.
- Total Hormuz Clearance: 10.3 mb/d against 17.2 mb/d, about 60%.
- Strait tanker crossings: a seven-day average of 12 a day against a pre-war level of 50, about 24%.
The ranking tells the story. The bypass route is running above normal, while arrivals still reflect the past. Meanwhile, the strait itself is operating far below capacity. Even after adding Gulf of Oman terminals and the Red Sea, Kpler puts the regional seven-day average at 16,441 kb/d. In other words, the region is about 30% below its baseline.
However, one caveat is important. Kpler stresses that every figure counts only confirmed flows, so each is a floor that can revise upward. In fact, its recent preliminary figures have typically settled 1.5 to 2 times higher once confirmations arrive. So the latest week may look less severe in hindsight. For that reason, the direction of travel matters more than the precise level.
Why arrivals are a lagging indicator
A tanker leaving the Gulf takes weeks to reach Asian ports. In a stable market, that lag does not matter. In a crisis, however, import statistics describe conditions from a month earlier. So if loadings and crossings stay at current levels, the shortfall will appear in Asian import data in the weeks ahead.
Kpler’s briefing also shows stress building elsewhere in the system:
- China is importing 2.4 mb/d less than before the war. It is also drawing down its crude stocks at a record pace.
- Iran has not loaded a crude or condensate cargo since 25 August under the US blockade.
- According to Kpler Insight, Aramco has cut its November official selling prices to Asia to a six-year low. Record freight is pushing Gulf sellers to compete on price.
- Kpler Insight says hauling two million barrels from the Gulf of Oman to North-east Asia costs around $22 a barrel. A month earlier, it cost less than $10.
The last two points matter together. Gulf crude may look cheaper on paper. However, freight and war risk make it dearer by the time it reaches Asia.
Arrivals show where the market was. Loadings show where it is going.
Bypass routes around the Strait of Hormuz have limits
The above-baseline loadings at Fujairah and Oman show that bypass infrastructure is doing real work. In fact, Kpler reports that bypass supply from Fujairah and Oman covered 48% of Singapore’s crude imports in September.
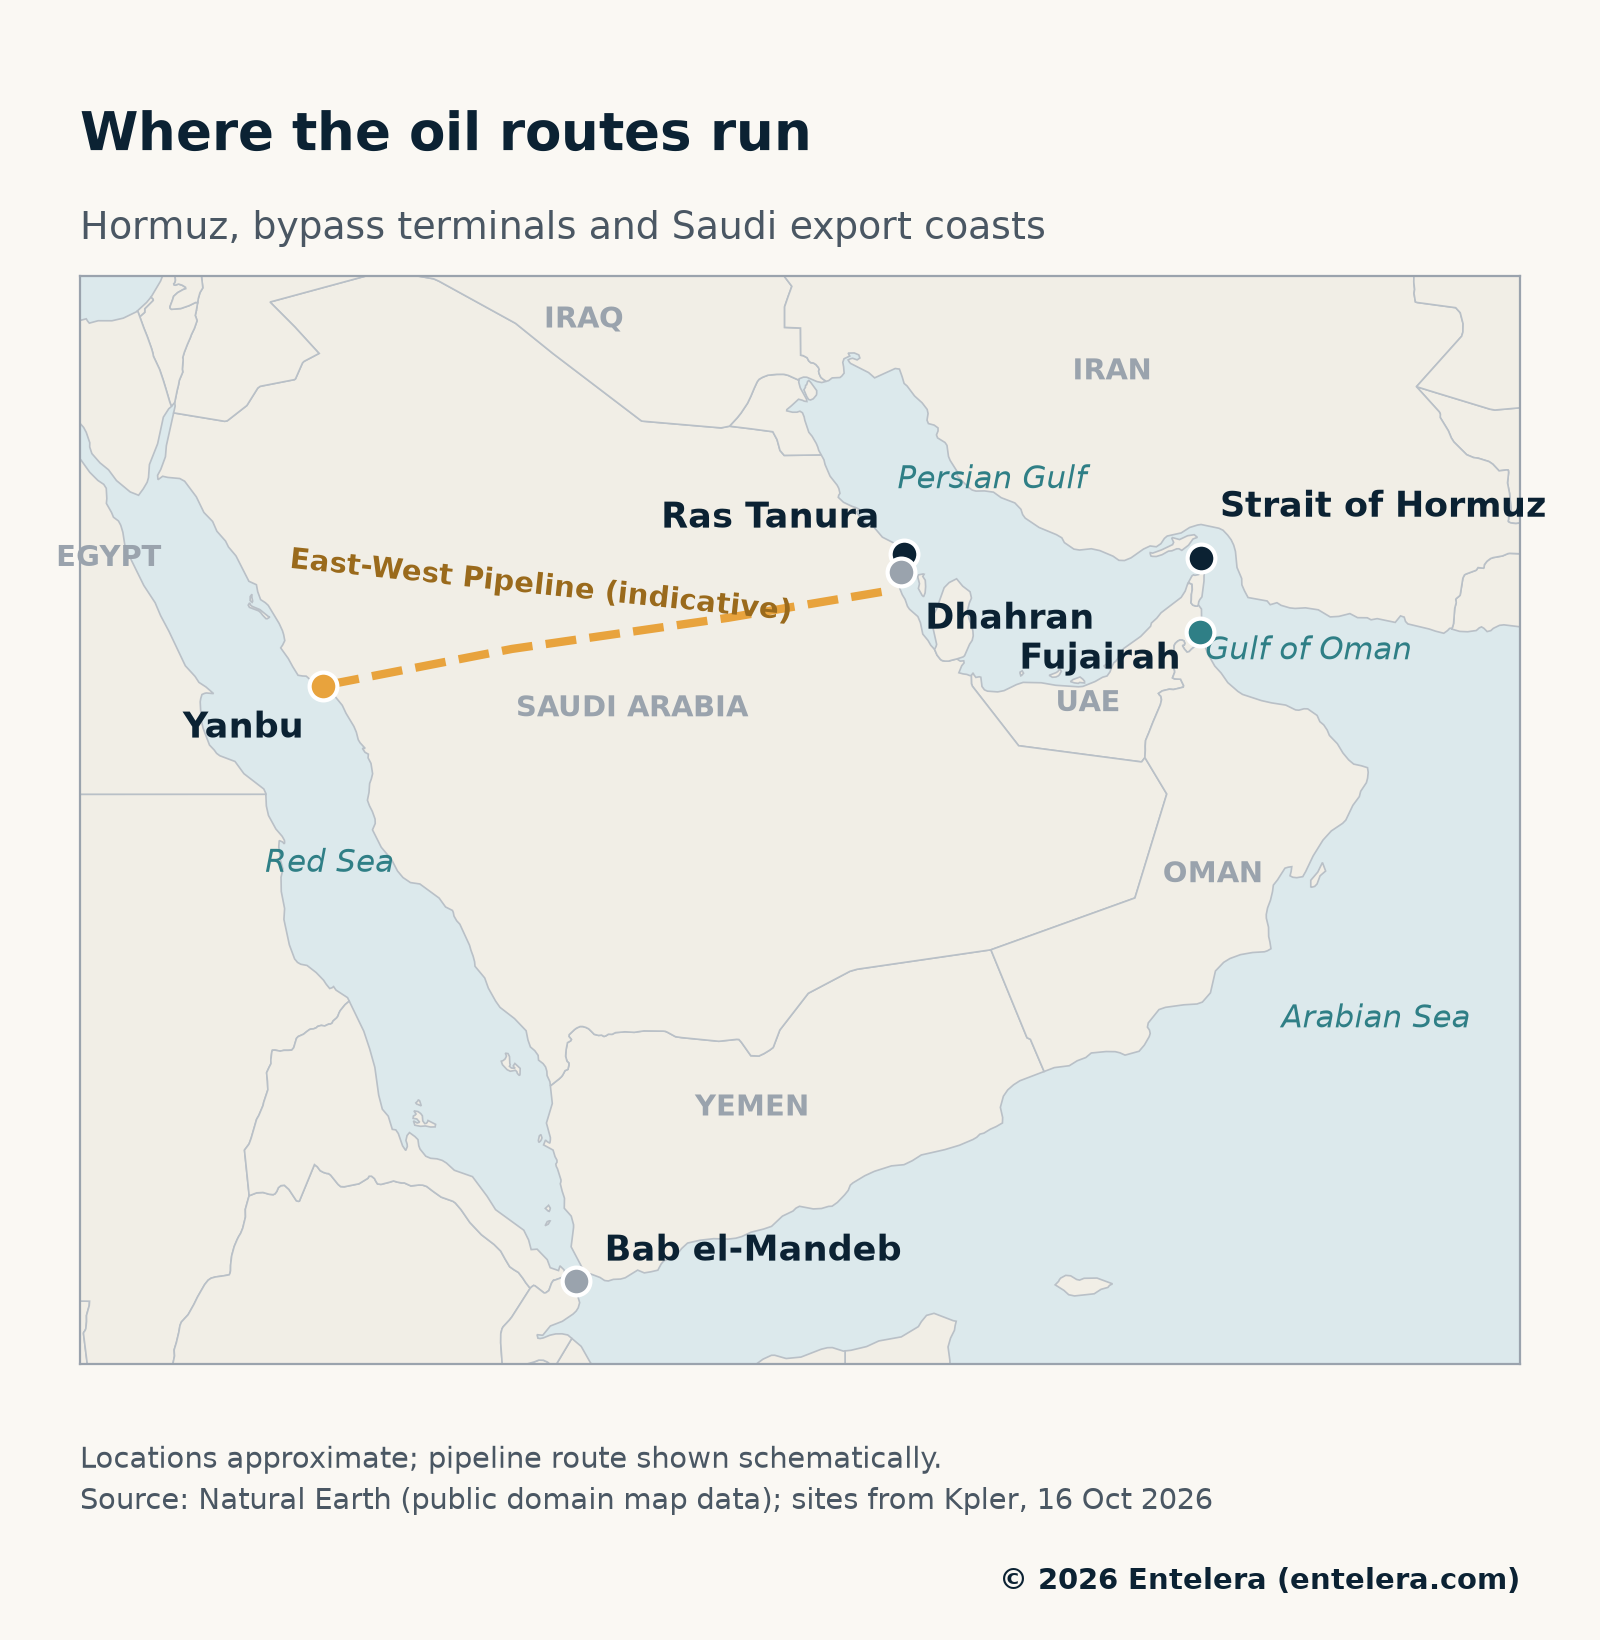
Saudi Arabia’s East-West Pipeline, also called Petroline, is the other major outlet. Industry sources cited by Kpler put its flow at around 5.8 mb/d on 12 October. Before an attack in September damaged a pumping station, it carried 5.4-5.5 mb/d.
However, Houthi threats are pushing Saudi exports back towards the Gulf coast. For example, Kpler Insight’s provisional data show Yanbu crude loadings slowing to around 668 kb/d this week, from 3.1 mb/d. Over the same period, Ras Tanura loadings rose to 6.25 mb/d from 3.57 mb/d.
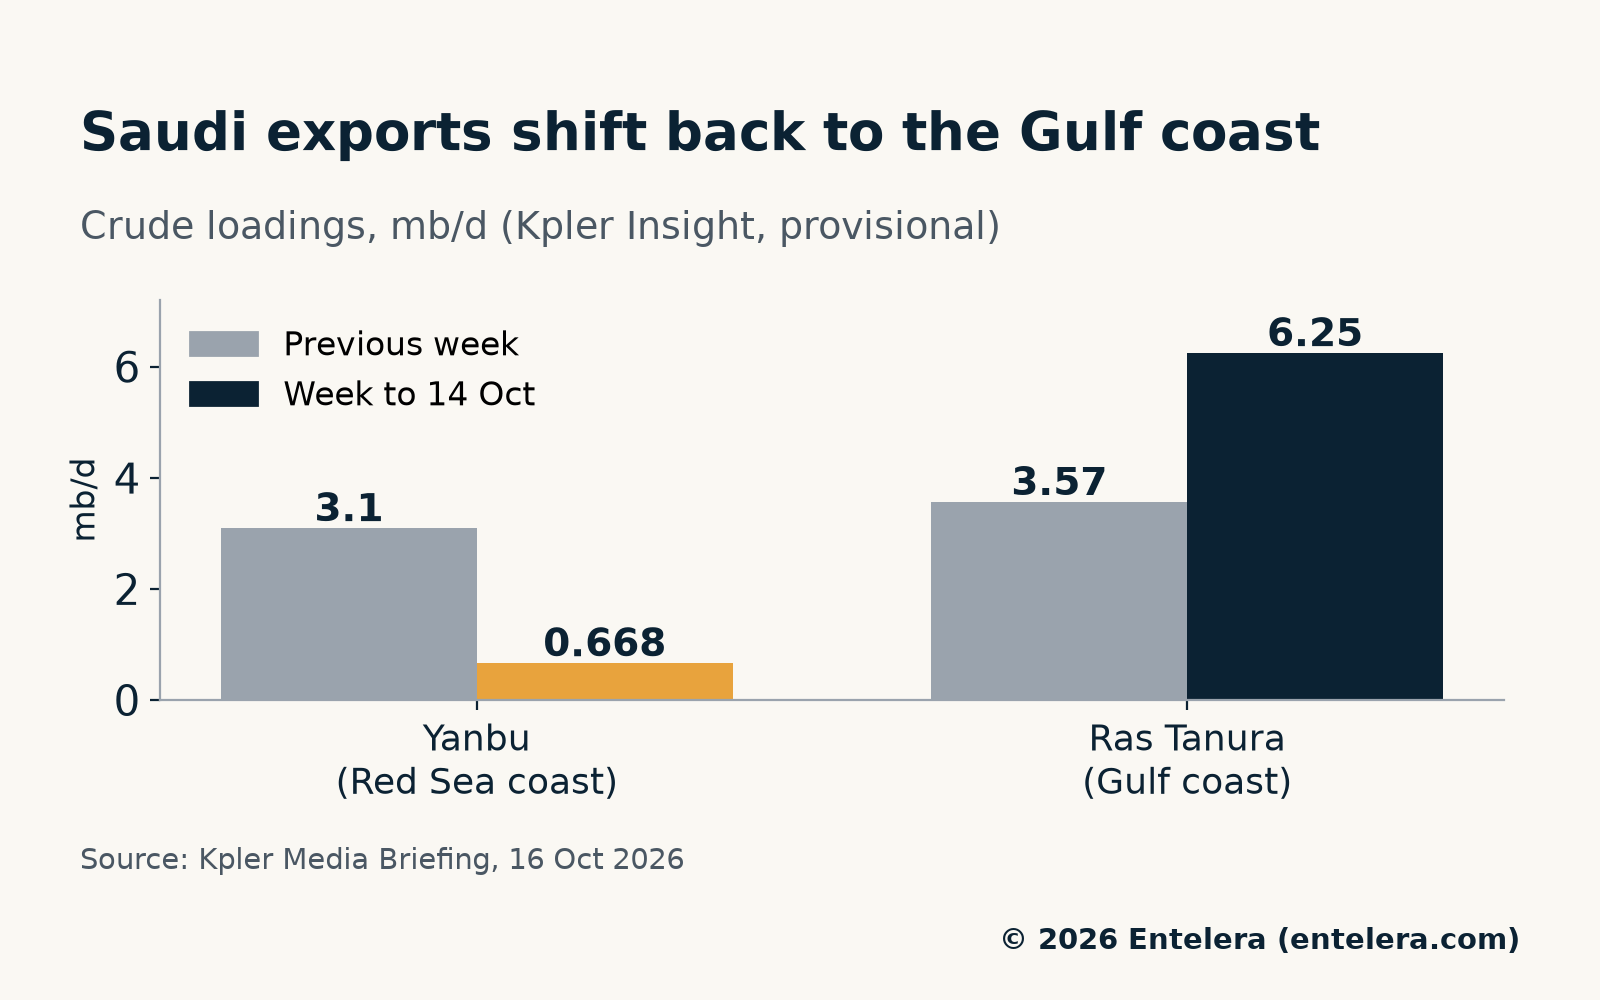
Still, expanding the bypass takes time. For instance, the Saudi energy ministry plans to lift pipeline capacity to 10 mb/d from 7 mb/d. However, Kpler says this could take up to three years. In short, bypass capacity is a cushion, not a substitute for an open strait.
Implications for India, Europe and the US
India and other Asian importers: The numbers to track are Gulf loadings and strait crossings, not this month’s arrivals. Therefore, comfortable October arrivals are no reason to slow inventory building or supplier diversification. Refiners with access to crude loaded outside the Gulf, or through bypass terminals, also hold a timing advantage.
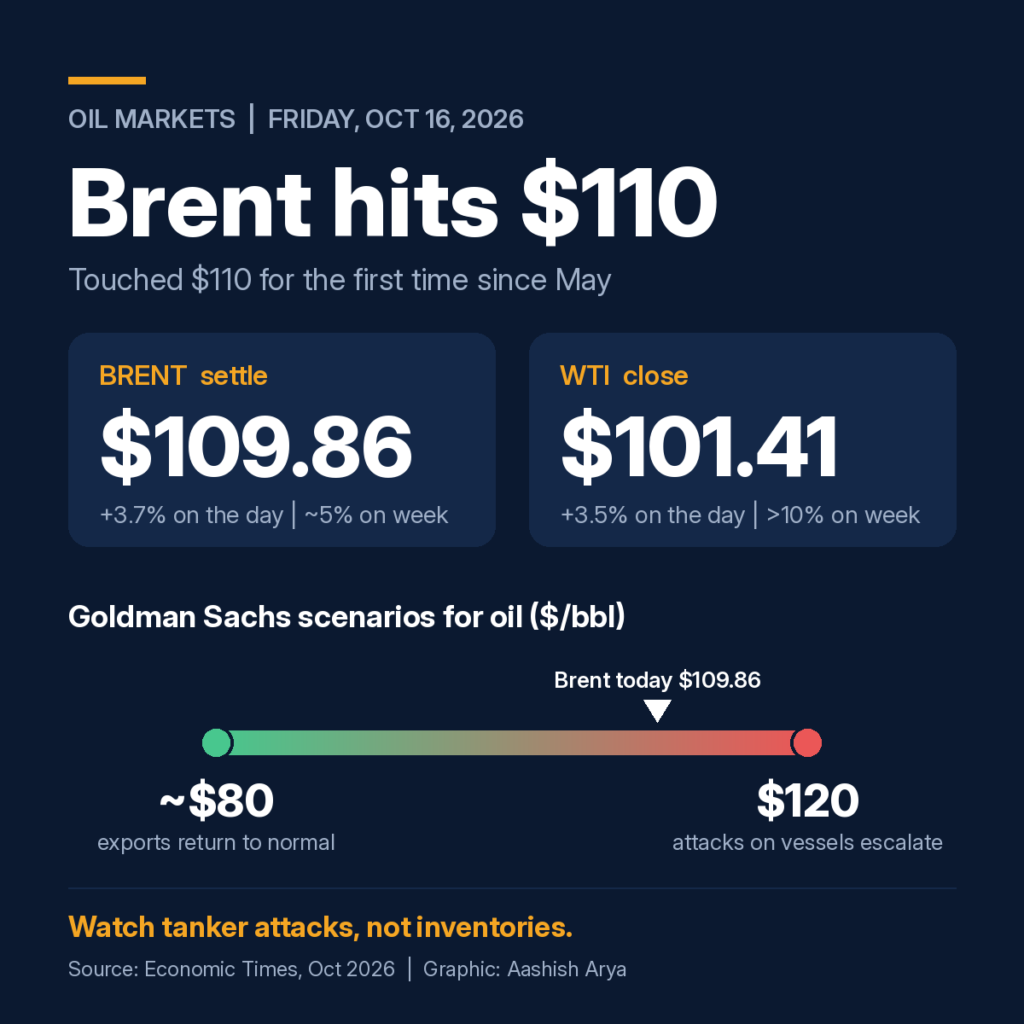
Price also adds to the strain. Our analysis of Brent at $110 explains why shipping risk now drives oil.
Europe: Kpler describes diesel as the tightest part of the barrel. It also estimates the global diesel deficit at around 1 mb/d as peak seasonal demand begins. Lower Gulf flows and stalled Middle East clean product exports add to that strain.
United States: The claims made by each side carry market weight. CENTCOM’s chief said 400 ships and 100 million barrels of oil had moved through the strait over the past week. However, that figure contrasts sharply with the Kpler and UKMTO data. Until independent data confirms a recovery, markets are likely to trust the tracking figures more than either side’s statements.
What to watch next in the Strait of Hormuz
- Kpler’s revised figures for the latest week, given the typical 1.5-2 times upward revision.
- Daily tanker crossings relative to the pre-war level of 50.
- UKMTO’s weekly transit counts and attack tallies.
- Asian import data for late October and November, when cargoes loaded during the current slump would arrive.
- Saudi export routing between Yanbu and Ras Tanura, and progress on the pipeline expansion.
- Freight rates on Gulf-to-Asia routes, as a measure of war-risk pricing.
For Asian importers, the near-term risk is complacency. After all, the data that looks reassuring today describes September. Meanwhile, the data that matters for November already points the other way.
Sources
- Kpler, “Kpler Media Briefing: Middle East Energy and Maritime Disruptions”, 16 October 2026 (flow data to 14 October): kpler.com (PDF)
- UKMTO, Voluntary Reporting Area weekly overview, week ending 16 October 2026: ukmto.org (PDF)
- Al Jazeera, “Iran says two tankers catch fire after hitting mines in Strait of Hormuz”, 18 October 2026: aljazeera.com
- Al Jazeera, “US and Iran both claim control of Strait of Hormuz amid attacks on vessels”, 17 October 2026: aljazeera.com